


Welcome aboard, future data enthusiasts!
Today, we’re embarking on an exhilarating journey into the dynamic realm of data analytics, where numbers transform into valuable insights and decisions are powered by the language of information.
In our exploration, we’re setting our sights on three fascinating companions: Descriptive, Predictive, and Prescriptive analytics.
These aren’t just fancy terms; they’re the keys that unlock the doors to understanding, forecasting, and optimizing the future.
So, if you’re a tech-savvy explorer, navigating the data analytics realm can be smoother with a data analysis course, as you can fully understand the factors that shape the analytics base.
Now get ready to dive into the friendly universe where numbers tell stories, patterns are the plot twists, and your curiosity is the compass guiding you toward an exciting career in data analytics!
Why Knowing About the Different Types of Data Analytics is Crucial

In the pulsating heartbeat of the digital age, information is the lifeblood of decision-making and innovation.
Imagine driving a car with only a rearview mirror – you’d miss the road ahead. Similarly, in the vast data landscape, each type of analytics serves as a unique lens, offering distinct perspectives.
Descriptive analytics paints the historical backdrop, telling you where you’ve been; Predictive data analytics peers into the foggy horizon, forecasting what lies ahead. Prescriptive analytics acts as your trusty GPS, guiding you on the optimal path forward.
In the business realm, this trinity of analytics is a strategic necessity.
Understanding the past helps you learn from it, predicting the future empowers you to stay ahead of the curve, and prescribing actions ensures you’re not just a passenger but the captain of your data-driven ship.
Whether you’re steering a company towards success or carving your niche in the dynamic field of data analytics, the knowledge of these analytics types is your compass.
It transforms raw data into actionable insights, transforming ambiguity into clarity and making decisions into milestones.
So, why is knowing about the different types of data analytics crucial?
Because in a world where data is king, wielding the right analytics is your royal decreea testament to your prowess in navigating the complexities and unlocking the limitless potential of the digital universe.
After all, in this era of information, those who understand how to harness it are the architects of progress, and you, dear reader, are on the path to becoming just that.
What are the Three Different Types of Data Analytics?

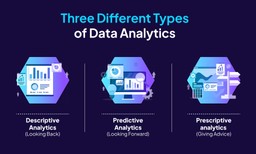
Let’s break down the three different types of data analytics:
Descriptive Analytics (Looking Back)
What it does: Descriptive analytics summarizes historical data to provide a comprehensive understanding of what has happened in the past. It’s like creating a detailed map of where you’ve been, allowing you to identify trends, patterns, and anomalies.
Example: If you check how many ice creams were sold last summer, that’s descriptive analytics. It tells you the total sales and helps you spot trends, like whether more ice creams were sold on hotter days.
Predictive Analytics (Looking Forward)
What it does: Predictive analytics is like weather forecasting for various situations. It uses data to make smart guesses about future outcomes. It dons the fortune-teller’s hat, leveraging historical data, data mining, statistical algorithms, and machine learning to make educated predictions about what might happen next.
Example: If you use data to predict that more people might buy ice creams during a heatwave next summer, that’s predictive analysis. Once you choose to use predictive analytics models, they can help you prepare for what’s likely to come.
Prescriptive Analytics (Giving Advice)
What it does: Prescriptive analytics is your helpful friend who predicts what might happen and suggests the best actions. It’s like having a guidebook for making intelligent decisions. Drawing on a blend of data, algorithms, and business rules, it becomes your trusted advisor, suggesting optimal strategies to achieve desired outcomes.
Example: If prescriptive analytics says, “Since it’s going to be really hot next summer, stock up on popular ice cream flavors and consider offering discounts,” it’s giving you advice on making the most of the predicted situation.
These three friends work together to make sense of data, plan for the future, and make smart moves in the present.
7 Examples of How to Use These Three Types in Real Life

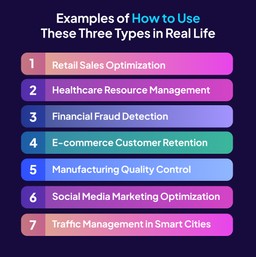
Now let’s explore seven real-life examples of how to use descriptive, predictive, and prescriptive analytics:
Retail Sales Optimization:
- Descriptive: Analyze past sales data to understand which products were popular during specific seasons.
- Predictive: Forecast future sales based on trends and external factors like holidays or economic conditions.
- Prescriptive: Recommend stocking up on trending products before peak seasons and offering targeted promotions to boost sales.
Healthcare Resource Management:
- Descriptive: Examine historical patient data to identify hospital admissions and resource usage patterns.
- Predictive: To allocate resources efficiently to predict the potential influx of patients during flu seasons or other health crises.
- Prescriptive: Suggest optimized staffing levels and resource allocation to handle predicted patient surges effectively.
Financial Fraud Detection:
- Descriptive: Analyze historical transaction data to identify patterns associated with fraudulent activities.
- Predictive: Use machine learning models to predict potential fraudulent transactions in real time.
- Prescriptive: Recommend immediate action, such as blocking suspicious transactions and alerting customers, to prevent financial losses.
E-commerce Customer Retention:
- Descriptive: Examine past customer behavior to understand purchasing patterns and preferences.
- Predictive: Predict which customers risk churning based on their recent activities and interactions.
- Prescriptive: Recommend personalized incentives or discounts to retain customers identified as high-risk for leaving.
Manufacturing Quality Control:
- Descriptive: Analyze historical production data to identify trends in product defects or quality issues.
- Predictive: Predict potential quality issues by monitoring real-time data from manufacturing processes.
- Prescriptive: Provide recommendations for process adjustments or improvements to enhance overall product quality.
Social Media Marketing Optimization:
- Descriptive: Analyze past social media campaigns to understand which content resonated the most with the target audience.
- Predictive: Forecast the potential reach and engagement of upcoming social media campaigns based on historical performance.
- Prescriptive: Recommend content strategies and posting schedules to maximize audience engagement and campaign success.
Traffic Management in Smart Cities:
- Descriptive: Analyze historical traffic data to identify peak congestion times and traffic patterns.
- Predictive: Predict future traffic conditions based on factors like events, weather, and construction projects.
- Prescriptive: Recommend dynamic traffic management strategies, such as adjusting signal timings or rerouting, to alleviate congestion during predicted peak times.
These examples illustrate how combining descriptive, predictive, and prescriptive analytics can provide valuable insights, anticipate future trends, and guide informed decision-making across various industries.
What are the Tools Used in Each Type of Data Analytics?
Different types of data analytics involve using various data tools to gather, process, and derive insights from data.
Here are examples of tools commonly used in each type:
Descriptive Analytics
- Tools:
- Microsoft Excel: Widely used for basic data summarization, charting, and trend analysis.
- Tableau: Allows for creating interactive and visually appealing dashboards to represent historical data.
- Google Analytics: Tracks website and user activity, providing insights into past performance.
Predictive Analytics
- Tools:
- R: A programming language and software environment specifically designed for statistical computing and predictive modeling.
- Python (with libraries like scikit-learn and TensorFlow): Offers versatile machine learning capabilities for predictive modeling.
- IBM SPSS: Statistical software for advanced analytics, including predictive modeling.
Prescriptive Analytics
- Tools:
- OptaPlanner: An open-source constraint satisfaction solver for resource optimization and planning.
- IBM Decision Optimization: A tool for building and deploying optimization models to guide decision-making.
- SAS Business Intelligence: Integrates reporting, analytics, and data visualization to support prescriptive analytics.
It’s important to note that the lines between these categories can blur, and many tools support multiple types of analytics.
For example, Tableau can be used for both descriptive and some aspects of predictive analytics, depending on how it’s configured and integrated with other tools.
Similarly, Python can be used for a broad range of analytics tasks, from descriptive statistics to machine learning and optimization, making it a versatile choice across the analytics spectrum.
The choice of tools often depends on the analysis’s specific needs, the data’s scale, and the users’ expertise.
As technology evolves, new tools continue to emerge, offering enhanced capabilities and making data analytics more accessible to a broader audience.
How to Get Started with Each Types of Data Analytics
Getting started with each type of data analytics involves a combination of learning key concepts, acquiring practical skills, and gaining hands-on experience.
Here’s a guide to kickstart your journey into descriptive, predictive, and prescriptive analytics:
Descriptive Analytics
Learn the Basics:
- Familiarize yourself with basic statistical concepts like mean, median, mode, and standard deviation.
- Understand how to visualize data using charts, graphs, and tables.
Explore Tools:
- Start with user-friendly tools like Microsoft Excel or Google Sheets for basic data manipulation and visualization.
- Progress to more advanced tools like Tableau for creating interactive dashboards.
Online Courses:
- Take online courses or tutorials covering descriptive statistics and data visualization.
- Platforms like Coursera, Udacity, and Khan Academy offer excellent resources.
Practice with Real Data:
- Work on real datasets to apply your knowledge.
- Platforms like Kaggle provide datasets and competitions to practice descriptive analytics.
Predictive Analytics
Learn Basic Statistics:
- Build a strong foundation in statistics, including concepts like regression and probability.
- Understand the basics of machine learning algorithms.
Programming Skills:
- Learn a programming language commonly used in data science, such as Python or R.
- Familiarize yourself with libraries like scikit-learn (Python) or caret (R) for machine learning.
Online Courses and Certifications:
- Enroll in online courses specializing in predictive analytics.
- Platforms like edX and DataCamp offer comprehensive courses.
Hands-On Projects:
- Engage in practical projects to apply predictive modeling techniques.
- Kaggle provides datasets and competitions for hands-on experience.
Prescriptive Analytics
Understand Optimization:
- Learn the basics of optimization techniques and linear programming.
- Understand decision-making processes and constraints.
Master Optimization Tools:
- Explore optimization tools like OptaPlanner, IBM Decision Optimization, or open-source solvers like PuLP for Python.
- Understand how to model business problems for optimization.
Advanced Analytics Courses:
- Take courses or certifications that delve into prescriptive analytics and decision optimization.
- Platforms like IBM Skills, edX, or MIT OpenCourseWare offer relevant content.
Case Studies:
- Explore real-world case studies applying prescriptive analytics to solve business problems.
- Analyze how optimization models can be used for resource allocation and decision support.
General Tips
- Networking:
- Join data science communities, forums, and attend meetups to connect with professionals in the field.
- Continuous Learning:
- Stay updated on the latest tools, techniques, and industry trends through blogs, webinars, and conferences.
- Build a Portfolio:
- Showcase your skills by creating a portfolio of projects on platforms like GitHub or personal websites.
Remember, practical experience is key in the world of data analytics.
As you progress, challenge yourself with diverse datasets and real-world problems to refine your skills and build a robust foundation in each type of data analytics.
Empowering Your Data Journey with Syntax Technologies

In the vast landscape of data analytics, the trio of descriptive, predictive, and prescriptive analytics emerges as the compass guiding us through the complexities of the digital universe.
As we conclude our exploration, it’s clear that understanding the past, predicting the future, and prescribing actions based on data are not just strategies but imperatives for success in today’s data-driven world.
And on this thrilling journey, Syntax Technologies stands as your trusted ally.
With a commitment to demystifying the intricacies of data, Syntax Technologies provides cutting-edge tools and resources to enhance your comprehension of the data universe.
As you embark on your adventure in data analytics, remember that Syntax Technologies is here to empower you, ensuring that you navigate the complexities and thrive in a world where data isn’t just informationit’s the key to unlocking boundless possibilities.
Cheers to your journey of discovery and success in the dynamic field of data analytics!