


Have you ever wondered how a Data Analytics Course can be the catalyst for propelling your career forward?
According to the WEF, analytical jobs are expected to be most in-demand in 2023 and beyond. So, if you’re thinking about jumpstarting your path toward data analytics, now is the perfect time to do it!
Just envision transforming raw data into actionable insights, making pivotal decisions, and distinguishing yourself in a competitive professional landscape.
The impact of a data analytics course is profound, and exploring this dynamic field could be the key to advancing your career.
So, take a seat, and let’s explore how this incredible journey might be precisely what you need to advance your career!
Why Has Data Analytics Become Crucial?
In our fast-paced world, where information is a currency and decisions need to be made at the speed of light, data analytics has become nothing short of crucial.
Imagine a world where every bit of information is a puzzle piece, and data analytics is the magic wand that turns those pieces into a clear, insightful picture.
So think of it as a career’s secret weapon. This not-so-hidden gem enables professionals to see patterns, make predictions, and navigate the complex information landscape with finesse.
Discovering the power of data analytics wasn’t just about dealing with numbers; it was about understanding the story behind those numbers.
Suddenly, decisions weren’t shots in the dark; they were well-informed moves backed by data-driven insights.
It’s like having a superpower in the professional realm, where individuals can anticipate trends, identify opportunities, and contribute meaningfully to an organization’s success.
In a nutshell, data analytics isn’t just a career choice; it’s a mindset, a way of seeing the world in a sea of information. Once the mindset is unlocked, there’s no turning back.
So, buckle up for a journey where professionals not only gather data but wield it like pros to steer their careers to new heights!
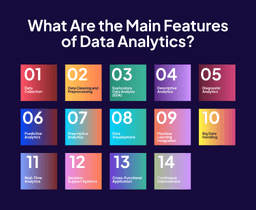
What Are the Main Features of Data Analytics?

Data analytics is a multifaceted field that involves examining, interpreting, and drawing meaningful insights from data.
The main features of data analytics encompass a range of techniques and processes aimed at uncovering patterns, trends, and valuable information from various data sources.
Here are the key features of data analytics:
Data Collection:
Data analytics begins with the collection of relevant data from various sources, which can include structured databases, unstructured text, images, videos, and more.
Data Cleaning and Preprocessing:
Raw data is often messy, incomplete, or contains errors. Data cleaning involves refining and preparing the data for analysis by addressing missing values, inconsistencies, and inaccuracies.
Exploratory Data Analysis (EDA):
EDA involves examining the data visually and statistically to understand its characteristics. This phase helps identify patterns, relationships, and potential outliers.
Descriptive Analytics:
Descriptive analytics focuses on summarizing and describing the main features of a dataset. It includes measures like mean, median, mode, and visualizations such as histograms and pie charts.
Diagnostic Analytics:
Diagnostic analytics aims to uncover the reasons behind past events or trends. It involves deeper analysis to understand the root causes of specific outcomes or occurrences.
Predictive Analytics:
Predictive analytics uses statistical algorithms and machine learning models to forecast future trends based on historical data. This feature is crucial for making informed decisions and planning for the future.
Prescriptive Analytics:
Prescriptive analytics goes beyond predicting outcomes. Analyzing data this way provides recommendations on actions to take to optimize results. This involves using optimization and simulation techniques.
Data Visualizations:
Data visualization tools are employed to represent data in graphical formats, making it easier to understand complex relationships and patterns. Common visualization data analysis tools include charts, graphs, heatmaps, and dashboards.
Machine Learning Integration:
Machine learning algorithms are often applied in data analytics to automate the process of identifying patterns and making predictions. This includes algorithms for classification, regression, clustering, and more.
Big Data Handling:
Data analytics deals with large volumes of data, often referred to as big data. Technologies like Hadoop and Spark are used to process and analyze data efficiently.
Real-Time Analytics:
In certain applications, especially in fields like finance and cybersecurity, real-time analytics is essential. This involves analyzing and responding to data as it is generated to make immediate decisions.
Decision Support Systems:
Data analytics provides support for decision-making by offering insights and actionable information. Decision support systems integrate data analytics to aid individuals and organizations in making informed choices.
Cross-Functional Application:
Data analytics is not limited to a specific industry. Its cross-functional application allows it to be utilized in diverse fields such as healthcare, finance, marketing, sports, and more.
Continuous Improvement:
Data analytics is an iterative process. As new data becomes available and models are refined, the analytics process can be continuously improved to enhance accuracy and relevance.
These features enhance data analytics’ power and versatility, helping derive valuable insights for informed decision-making.
How Data Analytics Is Used in Many Fields
Data analytics is a versatile powerhouse that has found its way into numerous fields, transforming how professionals make decisions, solve problems, and uncover valuable insights.
Let’s take a look at how data analytics is making a significant impact across various domains:
Healthcare:
- Patient Outcomes: Analyzing patient data can help predict outcomes, personalize treatment plans, and enhance overall healthcare delivery.
- Epidemiology: Identifying disease trends and outbreaks by analyzing patterns in large datasets.
Finance:
- Fraud Detection: Detecting irregular patterns in transactions to prevent fraudulent activities.
- Investment Analysis: Using historical data to make informed investment decisions and predict market trends.
Marketing:
- Customer Segmentation: Analyzing customer data to identify segments for targeted marketing campaigns.
- Social Media Analytics: Understanding customer sentiments and preferences through social media data.
Education:
- Student Performance: Analyzing academic data to identify areas for improvement and personalize learning experiences.
- Institutional Planning: Using data to forecast enrollment trends and plan resource allocation.
Retail:
- Inventory Management: Optimizing inventory levels based on historical sales data and demand forecasting.
- Customer Behavior: Analyzing purchase patterns to personalize marketing and improve customer experience.
Manufacturing:
- Predictive Maintenance: Using sensor data to predict equipment failures and schedule maintenance proactively.
- Quality Control: Analyzing production data to identify defects and improve product quality.
Human Resources:
- Recruitment Analytics: Streamlining the hiring process by analyzing candidate data and predicting successful hires.
- Employee Engagement: Analyzing employee feedback and performance data to enhance workplace satisfaction.
Transportation and Logistics:
- Route Optimization: Analyzing traffic and weather data science to optimize delivery routes and reduce transportation costs.
- Supply Chain Analytics: Managing and optimizing the supply chain for efficiency and cost-effectiveness.
Environmental Science:
- Climate Modeling: Analyzing historical climate data to model and predict future climate trends.
- Natural Resource Management: Using data to monitor and manage natural resources sustainably.
Sports Analytics:
- Performance data Analysis: Analyzing player and team performance data to make strategic decisions.
- Fan Engagement: Using data to enhance fan experiences and optimize marketing strategies.
These examples highlight data analytics’ extensive use in various fields. They underscore the vital role of data analysts in improving decision-making and discovering insights.
As technology continues to advance, the influence of data analysts is only expected to grow, creating new opportunities and revolutionizing industries.
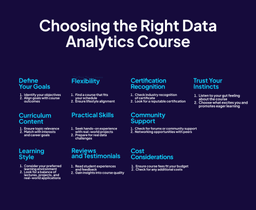
How to Decide Which Data Analytics Course is the Right One
Ready to dive into the exciting world of data analytics?
Here’s a friendly guide to help you decide which data analytics course is the one that’ll make your learning journey both enjoyable and super rewarding.
Define Your Goals:
Start by figuring out what you want to achieve. Are you aiming for a career switch towards analytics, leveling up your current job, or just exploring out of sheer curiosity? Knowing your goals will guide you to the right course.
Check the Curriculum:
Take a peek at the course syllabus. Does it cover the topics you’re excited about? Whether it’s Python data analysis, machine learning, or data visualization, make sure the content aligns with your interests and career aspirations.
Teaching Style Matters:
Think about how you like to learn. Do you thrive in interactive environments, or are you more of a solo learner? Check if the course offers the right mix of lectures, hands-on projects, and maybe even a sprinkle of real-world applications.
Choose something that aligns with your lifestyle, whether it’s a part-time evening class or an entirely online programFlexibility is Key:
Life can be a bit unpredictable, right? Look for a course that fits into your schedule. Whether it’s a part-time evening class or an entirely online program, choose something that aligns with your lifestyle.
Real-World Applications:
It’s not just about theory; it’s about practical data analytics skills, too. A good course should give you hands-on experience with real-world projects. This way, you’ll be ready to tackle data challenges like a pro when you step into the workforce.
Check Reviews and Testimonials:
It��’s like getting personalized recommendations from friends. Look for reviews and testimonials from people who’ve taken the course. Their experiences can provide valuable insights into the course quality and what to expect.
Certification Recognition:
Will your course give you a shiny certificate at the end? Check if it’s recognized in the industry. A reputable certification can be your golden ticket to opening doors in the analytics job market.
Community Support:
Learning is more fun when you’re not alone! Does the course have a community or forum where you can connect with fellow learners? Building a network can be as important as the course content itself.
Cost Considerations:
Let’s talk money! Check the course fees and see if it fits your budget. Also, look out for any additional costs, like software or materials, so you’re not caught off guard.
Trust Your Gut Feeling:
Finally, trust your instincts. If a course feels like the right fit, it probably is. Go with the one that excites you and makes you eager to learn every day.
Remember, this is YOUR journey. So, pick a course that aligns with your goals, suits your style, and makes learning about data analytics a truly enjoyable adventure!
What Should Data Analytics Courses Cover?
Alright, let’s unravel the rich tapestry of topics waiting for you in the Syntax Data Analytics course!
Data Fundamentals:
Embark on your data journey by mastering the basics. Get cozy with terms like “data types,” “structures,” and “formats” ? the building blocks of your data empire.
Programming Languages:
Brace yourself for a bit of coding magic. The course introduces you to languages like Python and R, making the art of talking to computers feel like learning a new, powerful language.
Statistical Analysis and Mathematics:
Ever wished math had a real-world application? Now it does! Stats and math become your trusty sidekicks as you unravel patterns and trends in data.
Data Cleaning and Preprocessing:
Not all data sparkles on arrival. Learn to handle messy data, clean it up, and prepare it for its red carpet debut.
Data Visualization in Python (Matplotlib & Seaborn):
Discover the stylish side of data. Create eye-catching charts and graphs that transform raw data into a visual masterpiece.
Database Management with SQL:
Enter the realm of databases. Become buddies with SQL, learning to store and retrieve data efficiently ? you’re the gatekeeper of a treasure trove of information.
Machine Learning Basics:
Get a taste of the future as you dip your toes into machine learning. Teach computers to make predictions ? it’s like having a digital fortune teller.
Business Intelligence (BI):
Elevate your data prowess by diving into the realm of Business Intelligence. Learn how to transform raw data into actionable insights, creating dynamic reports and dashboards.
It’s like turning data into a strategic compass, guiding decision-makers through the intricate landscapes of business challenges.
With BI in your toolkit, you’re not just analyzing data but illuminating the path to informed and impactful decision-making.
Big Data Concepts:
Welcome to the era of big data! Learn to handle massive datasets effortlessly, becoming the data superhero, tackling large volumes easily.
Real-World Applications:
The magic happens when theory meets practice. Work on real-world projects, solving actual problems using your newfound data analysis skills. It’s the ultimate test of your knowledge.
Ethics and Privacy:
As a responsible data superhero, dive into the ethical side of things. Learn to handle data responsibly, respect privacy, and ensure you use your powers for good.
And here’s the cherry on top ? the Syntax curriculum covers these essentials and delves into the intricacies of SQL, Power BI, Tableau, and ETL, including NumPy in Python.
It’s a comprehensive feast for anyone hungry for a deep dive into data analytics!
Starting Your Data Analytics Journey with Syntax Technologies

Can you feel the excitement bubbling up? Choosing a data analytics course is like unlocking a treasure chest of opportunities, and now you’ve got the map!
Speaking of maps, let us point you in the direction of something truly special. At Syntax Technologies, we’ve crafted a Data Analytics and Business Intelligence course that’s like no other.
Picture this:
Rigorous Instructor-Led Training: Our courses aren’t just about watching videos. You’ll have expert instructors guiding you through the maze of data analytics, ensuring you’re ready to conquer the data world.
Projects and Exercises: It’s not theory for the sake of theory. Get your hands dirty with real-world projects and exercises because, let’s face it, that’s where the real magic happens.
Job Assistance: Ready to take the plunge into the professional arena? We’ve got your back! Our job assistance program is your trusty companion, helping you navigate the job market and land that dream role.
Remote Learning: Life is busy, and we get that. That’s why our courses are designed for the modern world. Learn from the comfort of your favorite coffee shop or the coziness of your couch.
Certification: Our certification is your badge of honor, recognized in the industry and signaling to the world that you’re a certified data guru.
Mentor Support: Need a guiding star on your journey? Our mentor support is like having a wise wizard by your side, ready to share insights, advice, and a sprinkle of encouragement.
So, what are you waiting for? The data adventure of a lifetime awaits!
Join us at Syntax Technologies, where we’re not just teaching data analytics; we’re crafting future data wizards. Let’s embark on this thrilling journey together!