


Hey there, future data wizards! Ready to turn your knack for numbers into a portfolio that shouts, “I am the data maestro!”?
Creating a portfolio is as intimidating as debugging a nested loop for the first time.
But fear not! Whether you’re crunching numbers in your sleep or just dipping your toes into the vast sea of data analytics, we’ve got the tips and tricks that will elevate your portfolio game from “meh” to “heck yeah!”
Moreover, imagine turbocharging your journey to greatness with a data analytics course. You will hone your analytical prowess and gain insights and strategies to build a data analyst portfolio that practically shouts, “Hire me!”
We’ll unravel the secrets that textbooks won’t tell you, and by the end of this adventure, you’ll be armed not just with skills but with the confidence to conquer the data realm.
Ready to dive in? Let the portfolio-building adventure begin!
The Essence of a Standout Portfolio
A. Defining What Makes a Portfolio Stand Out
Crafting a unique and personalized portfolio involves more than presenting generic datasets. A data analytics student can infuse a personal touch by selecting projects related to their hobbies or passions.
For impactful content, it’s not just about predicting future trends but also crafting a narrative on how these insights could be practically applied, aiding businesses in making informed decisions.
Envision a portfolio that seamlessly caters to both technical recruiters and non-technical HR professionals, employing language and visuals that resonate with a diverse audience.
This adaptability ensures that the portfolio communicates effectively across various professional backgrounds and levels of technical expertise.
B. Emphasizing the Balance Between Technical Skills and Personal Touch
Demonstrating a high level of technical proficiency is paramount in a data analytics portfolio. Illustrate this proficiency through a project where you meticulously clean and analyze a complex dataset, extracting meaningful insights.
Additionally, emphasize your communication skills by not only detailing the technical aspects of your projects but also explaining their significance in layman’s terms.
This dual approach showcases your ability to convey complex ideas effectively to diverse audiences.
Furthermore, highlight your problem-solving capabilities by recounting a project where you encountered and successfully addressed unexpected challenges, whether it involved handling missing data or outliers.
This underscores your technical skills and exemplifies a strategic, adaptive problem-solving approach.
C. Importance of Showcasing Real-world Applications
Crafting a portfolio that resonates with your target industry is essential. Consider developing a project that directly addresses a prevalent issue in the sector you aim to join.
For instance, if finance is your focus, delve into the analysis of historical stock data, offering insights that can inform potential investment strategies.
Moreover, highlight a project with practical implications, showcasing how your analytics prowess led to tangible improvements.
Whether it’s optimizing a business process or providing actionable insights that influence decision-making, emphasizing real-world impact adds depth to your portfolio.
Demonstrate your versatility by featuring a diverse array of projects. From predictive analytics in healthcare to sentiment analysis on social media data, this showcases your ability to apply your skills across various domains.
Essential Components of a Data Analytics Portfolio

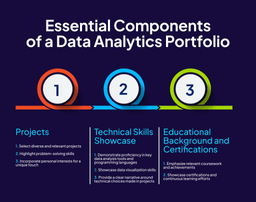
A. Projects
1. Selecting diverse and relevant projects
Example: Choose projects that span various domains within data analytics. For instance, have a predictive analytics project using machine learning, a data visualization project showcasing insights, and a data cleaning project demonstrating your ability to preprocess raw data effectively.
2. Highlighting problem-solving skills
Example: Showcase a project where you encountered a data quality issue and describe the steps taken to identify and rectify the problem. This will demonstrate technical skills and problem-solving prowess.
3. Incorporating personal interests for a unique touch
Example: If you are passionate about environmental issues, integrate a project analyzing datasets related to climate change or sustainability.
This personal touch will set your portfolio apart and reflect your commitment to projects aligned with your interests.
B. Technical Skills Showcase
1. Demonstrating proficiency in key data analysis tools and programming languages
Example: Clearly outline your proficiency in Python for data analysis, SQL for database querying, and proficiency in data visualization tools like Tableau. Provide a project that specifically highlights each of these skills.
2. Showcasing data visualization skills
Example: Feature a project where you transformed complex datasets into visually compelling insights using charts, graphs, and interactive dashboards. Visual appeal adds an extra layer of engagement to your portfolio.
3. Providing a clear narrative around technical choices made in projects
Example: In project descriptions, explain not just what you did but why you did it. If you chose a specific machine learning algorithm, clarify the rationale behind the choice, demonstrating a thoughtful and strategic approach.
C. Educational Background and Certifications
1. Emphasizing relevant coursework and achievements
Example: Highlight specific data science courses that directly contributed to your skills. If you took a course on data preprocessing, discuss how it improved your ability to clean and prepare data for analysis.
2. Showcasing certifications and continuous learning efforts
Example: Feature certifications in relevant areas such as machine learning or data visualization. Additionally, demonstrate a commitment to continuous learning by mentioning ongoing courses or self-directed learning initiatives.
Tailoring Your Portfolio for Success
A. Understanding Your Target Audience
1. Customizing Content: Tailor your portfolio to align with the expectations of potential employers.
2. Industry Relevance: Research the specific industries or companies you’re interested in and ensure your portfolio reflects projects and skills relevant to those sectors.
3. Highlighting Transferable Skills: Emphasize transferable skills universally valuable in data analytics, such as problem-solving, critical thinking, and effective communication.
4. Professional Tone: Maintain a professional tone throughout your portfolio. While it’s great to inject personality, ensure that it aligns with the industry norms you’re entering. Balance enthusiasm with a polished presentation to convey your passion and professionalism.
5. Clarity is Key: Clearly articulate your projects, skills, and achievements. Avoid jargon or overly technical language that may be unclear to those outside the data analytics field. Use concise and accessible language to explain complex concepts.
B. Aligning Your Portfolio with Industry Trends
1. Staying Current: Regularly update your portfolio to reflect the latest trends and technologies in the data analytics field. Showcase your awareness of industry advancements and ability to adapt to evolving methodologies.
2. Incorporating Emerging Technologies: If there’s a rising tool or technique in the field, consider integrating a project that demonstrates your proficiency with it. This signals to employers that you’re aware of current trends and proactive in embracing new technologies.
3. Showcasing Specializations: If you have a specific area of specialization within data analytics (e.g., machine learning, data engineering), ensure your data analyst portfolio reflects in-depth knowledge and hands-on experience in that particular niche.
C. Utilizing Feedback and Iteration to Enhance Your Portfolio Over Time
1. Seeking Constructive Feedback: Actively seek feedback from mentors, peers, or professionals in the field. Use their insights to identify areas of improvement in both content and presentation.
2. Continuous Iteration: Treat your portfolio as a dynamic document. Regularly update it based on new data analytics projects, skills acquired, or feedback received. This showcases a commitment to continuous improvement and growth.
3. Showcasing Growth: If possible, provide a section in your portfolio that highlights the evolution of your skills and projects over time. This narrative can demonstrate your capacity for learning and adaptation.
There are many data analyst portfolio examples you can find on the web to compare with yours and make the necessary adjustments.
The Impact of Taking a Data Analytics Course
A. The Benefits of Formal Education in Data Analytics
1. Structured Learning: Highlight how a formal data analytics course provides a structured learning environment, covering fundamental concepts, tools, and methodologies. This structured foundation equips you with a comprehensive understanding of the field.
2. Guidance from Experts: Emphasize the value of learning from experienced instructors and industry professionals who can provide insights, practical advice, and real-world examples.
3. Networking Opportunities: Mention how being part of a course often opens doors to networking with peers, professors, and professionals, potentially leading to valuable connections and opportunities.
B. Highlighting How a Course Can Enhance Skills and Knowledge
1. Hands-on Projects: Discuss the practical application of knowledge through hands-on projects offered in the course. For example, completing a project on data cleaning or predictive modeling demonstrates your ability to apply theoretical concepts in a real-world context.
2. Tool Proficiency: Detail how the course hones your proficiency in industry-relevant tools and technologies, making you more adept at handling diverse datasets and extracting meaningful insights.
3. Case Studies and Real-world Scenarios: Illustrate how exposure to case studies and real-world scenarios in the course enhances your problem-solving skills and prepares you for challenges encountered in the field.
C. Integrating Course Experiences and Projects into the Portfolio
1. Showcasing Course Projects: Feature notable projects from the course in your analytics portfolio, providing a glimpse into the challenges you’ve tackled and the solutions you’ve implemented.
2. Highlighting Course Achievements: If you received awards, certifications, or distinctions during the course, showcase them in a dedicated section of your portfolio. This adds credibility and validates your commitment to excellence.
3. Demonstrating Continuous Learning: Discuss any ongoing learning initiatives or advanced courses you’ve pursued beyond the primary curriculum, signaling your commitment to staying current in this rapidly evolving field.
By highlighting the impact of a data analytics course, you validate your education and showcase the enhancement of your skills, problem-solving abilities, and industry readiness.
Practical Tips and Tricks

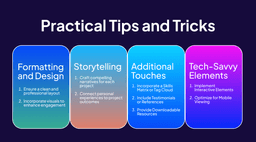
Formatting and Design
- Ensuring a clean and professional layout
Use a consistent color scheme and font style throughout your portfolio. Organize sections logically, making it easy for visitors to navigate and find relevant information.
- Incorporating visuals to enhance engagement
Integrate visuals directly into the portfolio to provide a quick visual representation of your data visualization skills. Visual elements break up text and make your portfolio more visually appealing.
Storytelling
- Crafting compelling narratives for each project
Instead of just stating the technical details of a project, tell a story. Describe the problem you aimed to solve, the challenges you faced, and the ultimate impact of your solution.
This narrative engages the reader and showcases your ability to communicate complex ideas effectively.
- Connecting personal experiences to project outcomes
Share personal insights or experiences related to a project. For instance, if you developed a data analysis tool for a personal passion, explain how your connection to the subject matter fueled your dedication to the project.
Additional Touches
- Incorporating a Skills Matrix or Tag Cloud
Create a visual representation of your skill set using a skills matrix or tag cloud. This provides a quick snapshot of your key competencies and technologies you’re familiar with.
- Including Testimonials or References
If applicable, consider including testimonials or references from professors, colleagues, or supervisors who can vouch for your skills and work ethic. This adds credibility to your portfolio.
- Providing Downloadable Resources
Offer downloadable resources such as a PDF version of your resume or a detailed project report. This allows potential employers to delve deeper into your background and accomplishments.
Tech-Savvy Elements
- Implementing Interactive Elements
If your projects involve interactive dashboards or web applications, embed them directly into your portfolio. This provides a hands-on experience for visitors, allowing them to interact with your work.
- Optimizing for Mobile Viewing
Ensure your portfolio is mobile-friendly. With recruiters often viewing data analyst portfolios on various devices, optimizing for mobile ensures a seamless and accessible experience for all audiences.
Charting Success: Navigating the Data Analytics Frontier and Beyond


Crafting a portfolio that not only showcases your skills but also tells a compelling story is your passport to success in the data analytics universe.
As you compete with many data analysts, remember your portfolio is a dynamic reflection of your growth, adaptability, and commitment to excellence.
The practical tips and tricks discussed here serve as a compass, guiding you to create a portfolio that not only stands out in the crowd but leaves a lasting impression on potential employers.
And speaking of the journey, what better way to embark on your data analytics adventure than with Syntax Technologies?
Our course is meticulously designed to provide you with the knowledge, skills, and industry insights needed to excel in data analytics.
So, if you’re just beginning your journey, Syntax Technologies is your partner in turning data into meaningful insights.