


Hey there!
Ready to dive into the captivating world of data analytics?
Choosing the right data analysis tools for your business is all about finding that harmonious blend that turns raw data into a masterpiece of insights.
And with the help of a data analytics course, you can ensure you have the right tools for a successful business!
Now grab your curiosity, and let’s embark on a journey where numbers transform into narratives and trends become your trusty sidekicks in the quest for business success.
Why Are Data Analytics Tools Important for Your Business?
In the ever-evolving business landscape, data isn’t just a collection of numbers; it’s the heartbeat of decision-making, the compass guiding your strategies, and the untapped gold mine of opportunities.
Data analytics tools let you make informed decisions, spot trends before they trend, and navigate the competitive terrain with the precision of a seasoned explorer.
These tools aren’t just for the big players; they level the playing field, empowering businesses of all sizes to harness the power of their data.
Here are some of the key reasons why data analytics tools are crucial for your business:
Informed Decision-Making:
- Transforms raw data into actionable insights.
- Enables data-driven decision-making processes.
Strategic Planning:
- Spot trends and patterns in the data before they become mainstream.
- Provides a comprehensive understanding of market dynamics.
Operational Optimization:
- Identifies inefficiencies and bottlenecks in business operations.
- Enhances process efficiency and resource utilization.
Competitive Edge:
- Empowers businesses of all sizes to compete on a level playing field.
- Allows for proactive adjustments based on market trends and consumer behavior.
Customer Insights:
- Predicts and understands customer behaviors and preferences.
- Personalizes marketing strategies for targeted engagement.
Risk Management:
- Identifies potential risks and vulnerabilities in real-time.
- Facilitates the development of risk mitigation strategies.
Performance Evaluation:
- Measures and evaluates the performance of products, services, and campaigns.
- Facilitates continuous improvement through data-driven feedback.
Cost Savings:
- Pinpoints areas where cost-cutting measures can be applied.
- Optimizes budget allocation for maximum ROI.
Accessibility and Democratization of Data:
- Makes data analysis accessible to employees across various departments.
- Fosters a culture of data-driven decision-making throughout the organization.
Adaptability and Scalability:
- Adapts to evolving business needs and market changes.
- Scales with the growth of the business, accommodating increased data volumes.
Data analytics tools aren’t just crucial for your business; they’re the secret sauce that turns the mundane into the extraordinary and the chaotic into the calculated.
Buckle up as we unravel the significance of these tools and explore why they’re not just an option but a necessity in the modern business playbook.
Ready to decode the language of data?
The Most Common Data Analytics Tools Used by Businesses + Examples


The realm of data analytics is vast, and businesses have many tools at their disposal to make sense of their data.
Here are some of the most common and widely used data analytics tools in the business world.
Let’s also discover how they can be used in various domains in the real world!
Microsoft Excel – Your Number Crunching Sidekick
- A versatile spreadsheet tool used for basic data analysis and visualization.
- Widely employed for simple calculations, charts, and graphs.
For example, imagine you’re a small bakery owner tracking your daily sales. Excel comes to the rescue, allowing you to quickly organize and analyze your sales data.
You uncover your bestselling treats with a few clicks and strategize your baking schedule accordingly.
SQL – Unraveling the Database Mysteries
- Essential for database management and querying.
- Allows businesses to extract, manipulate, and analyze data stored in relational databases.
For example, picture yourself managing an online store with a vast product inventory.
SQL helps you swiftly retrieve information about your most popular products, manage inventory levels, and even tailor your marketing campaigns based on customer preferences.
Tableau – Crafting Visual Masterpieces
- A robust data visualization tool that turns raw data into interactive, shareable dashboards.
- Enables users to create compelling visualizations without extensive coding.
For example, if you’re a marketing guru, Tableau transforms your campaign data into a vibrant visual feast.
Imagine dynamic dashboards showcasing the success of your latest campaign, making it a breeze to convey insights to the whole team.
Power BI – Illuminating Business Insights
- Microsoft’s business analytics tool for creating interactive reports and dashboards.
- Integrates with various data sources to provide real-time insights.
For example, as a business manager, Power BI becomes your flashlight in the dark caverns of data.
It seamlessly integrates with various data sources, providing real-time insights. You can monitor key performance indicators, track trends, and make informed decisions on the fly.
Google Analytics – Navigating the Online Wilderness
- Primarily used for web analytics, providing insights into website traffic and user behavior.
- Helps businesses understand online performance and optimize digital strategies.
For example, are you operating an e-commerce site? Google Analytics acts as your trusty guide, revealing where your website visitors come from, what interests them, and even where they might get stuck in the purchasing process.
It’s like having a GPS for your online success.
Python – Coding Magic for Data Wizards
- A versatile programming language with numerous libraries (e.g., Pandas, NumPy) for data manipulation and analysis.
- Widely adopted for machine learning and statistical analysis.
For example, whether you’re a data scientist or a curious entrepreneur, Python is your enchanted wand.
With libraries like Pandas and NumPy, you can effortlessly analyze and manipulate data, uncovering insights that spark innovation and growth.
R Programming – Statistical Wizardry
- A statistical programming language used for data analysis, visualization, and machine learning.
- Popular in academia and among statisticians.
For example, picture yourself in a research lab studying the effects of a new drug.
R Programming helps you crunch the numbers, run statistical analyses, and visualize your findings, turning complex data into a story that even non-scientists can understand.
SAS – Navigating Analytics Seas
- A comprehensive software suite for advanced analytics, business intelligence, and data management.
- Widely used in industries like finance, healthcare, and government.
For example, SAS is your sturdy ship in the vast ocean of data analytics. Industries like finance and healthcare rely on SAS for its robust analytics capabilities.
The compass guides decision-makers through the stormy seas of data complexity.
Apache Hadoop – Tackling Big Data Mountains
- An open-source framework for distributed storage and processing of large datasets.
- Scales horizontally to handle massive volumes of data.
For example, if you handle massive datasets, think of Apache Hadoop as your mountain guide.
It efficiently manages and processes colossal volumes of data, ensuring you can explore the peaks of insights without getting lost in the data avalanche.
MATLAB – Calculating Science Marvels
- A programming language and environment for numerical computing.
- It is commonly used in engineering and scientific research for data analysis and modeling.
For example, Imagine you’re an aerospace engineer designing a new aircraft.
MATLAB becomes your virtual testing ground, helping you simulate aerodynamics, analyze stress points, and optimize your design before the first bolt is tightened.
D3.js-Crafting Interactive Data Tales
- A JavaScript library for creating interactive and dynamic data visualizations in web browsers.
- Ideal for custom and aesthetically pleasing visualizations.
For example, as a creative web developer, D3.js is your artistic brush. Imagine you’re building a data-driven webpage for a travel agency.
D3.js helps you breathe life into your data, creating interactive maps showcasing the most popular destinations and turning a static website into an engaging user journey.
Alteryx-Simplifying Analytics for All
- An end-to-end analytics platform that simplifies data blending, preparation, and advanced analytics.
- Streamlines the analytics workflow for non-technical users.
For example, imagine you’re an operations manager drowning in disparate data sources in the corporate jungle.
Alteryx is your organizational superhero, simplifying the data blending and preparation process.
Suddenly, you can effortlessly merge data from different departments, providing a unified view that fuels more intelligent decision-making across the entire company.
How to Get Started with These Data Analytics Tools
Embarking on your data analytics journey is an exciting endeavor!
Here’s a step-by-step guide to help you get started with some of the common data analytics tools mentioned earlier:
Microsoft Excel:
Get the Software:
Download and install Microsoft Excel on your computer if you haven’t already.
Learn the Basics:
Explore basic functionalities such as entering data, creating formulas, and generating simple charts.
Online Resources:
Leverage online tutorials and resources to deepen your understanding. Websites like Microsoft’s support and YouTube offer a wealth of tutorials.
SQL (Structured Query Language):
Install a Database:
Set up a database (e.g., MySQL, PostgreSQL) on your machine or use an online service.
Learn SQL Basics:
Understand the fundamentals of SQL, including SELECT statements, filtering, and joining tables.
Practice:
Practice writing queries on your database to manipulate and retrieve data.
Tableau:
Download and Install:
Download and install Tableau Desktop. They often provide a trial version.
Online Training:
Explore Tableau’s online training resources, including webinars and tutorials on their official website.
Create Your First Visualization:
Import a sample dataset or use your own to create your first visualization. Experiment with different chart types and dashboards.
Power BI:
Get Power BI Desktop:
Download and install Power BI Desktop. It’s the free version and a great starting point.
Follow Guided Learning:
Power BI offers guided learning resources. Follow the step-by-step tutorials to understand the tool’s features.
Connect to Data:
Connect Power BI to your data source and create your first report or dashboard.
Google Analytics:
Set Up an Account:
If you have a website, set up a Google Analytics account and integrate it with your site.
Explore Reports:
Navigate through Google Analytics reports to understand user behavior, traffic sources, and content performance.
Experiment with Goals:
Set up goals to track specific actions on your website, such as form submissions or product purchases.
Python:
Install Python:
Install Python on your machine. You can use Anaconda, which includes popular data science libraries.
Learn Python Basics:
Familiarize yourself with basic Python syntax and data structures.
Explore Libraries:
Begin exploring data science libraries like Pandas and NumPy. Follow online tutorials and coding exercises.
R Programming:
- Install R:
Install R and RStudio, an integrated development environment for R. - R Basics:
Learn the basics of R programming, including data types, functions, and control structures. - Data Analysis with R:
Explore R packages for data analysis (e.g., dplyr, ggplot2) and practice analyzing datasets.
SAS (Statistical Analysis System):
- SAS University Edition:
Download and install SAS University Edition for free to practice. - Online Courses:
Enroll in SAS online courses or tutorials to understand the basics of statistical analysis and data manipulation. - Hands-On Projects:
Apply your knowledge to real-world data projects or datasets.
Apache Hadoop:
Setup Hadoop:
Install Hadoop on a local machine or set up a cluster if you’re dealing with big data.
Hadoop Ecosystem:
Familiarize yourself with the Hadoop ecosystem, including components like HDFS and MapReduce.
Hands-On Practice:
Practice storing and processing data using Hadoop. Many online platforms offer sandboxes for experimentation.
MATLAB:
Install MATLAB:
Install MATLAB on your machine. MathWorks, the developer of MATLAB, provides trial versions.
MATLAB Basics:
Learn the basics of MATLAB programming, including matrices, functions, and plotting.
Data Analysis with MATLAB:
Explore MATLAB’s data analysis and visualization capabilities. Work on sample datasets to apply your skills.
D3.js:
Get Started:
Start by including D3.js in your web project. You can link it directly or use a package manager like npm.
Learn SVG:
Understand Scalable Vector Graphics (SVG), which D3.js manipulates to create visualizations.
Tutorials and Examples:
Follow D3.js tutorials and explore examples to create your own interactive visualizations.
Alteryx:
Install Alteryx Designer:
Download and install Alteryx Designer. They often provide a trial version.
Alteryx Academy:
Explore Alteryx Academy for free online training courses covering data blending, preparation, and advanced analytics.
Workflow Creation:
Start building your first workflow in Alteryx, incorporating data from different sources and applying transformations.
Remember, the key is to start small, practice consistently, and gradually build your skills.
Each tool has its learning curve, but with persistence and a curious mindset, you’ll soon find yourself confidently navigating the world of data analytics!
How to Decide Which Tools Are Best for Your Business

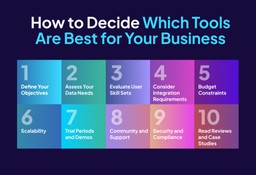
Choosing the right data analytics tool for your business is a bit like assembling a superhero squad ? each tool has unique strengths, and the key is building a team that complements your specific needs.
Here’s a friendly guide on how to decide which tools are best for your business:
Define Your Objectives:
What are your business goals? Whether optimizing operations, understanding customer behavior, or predicting market trends, align your tool choices with your overarching objectives.
Assess Your Data Needs:
Consider the types of data you’ll be dealing with ? structured or unstructured, big or small. Some tools excel in handling massive datasets, while others are more suitable for quick analyses of smaller sets.
Evaluate User Skill Sets:
Take stock of your team’s technical proficiency. Some tools are user-friendly for beginners, while others may require more advanced programming skills. Choose tools that match your team’s expertise or invest in training if needed.
Consider Integration Requirements:
Assess the compatibility of the tools with your existing systems. Seamless integration is key to avoiding data silos and ensuring a smooth workflow across your organization.
Budget Constraints:
While the cost shouldn’t be the sole determinant, it’s a practical consideration. Evaluate the cost of acquiring, implementing, and maintaining the tools over time. Consider both short-term and long-term expenses.
Scalability:
Think ahead. Will the tools be able to grow with your business? Choose tools that can adapt to increasing data volumes and evolving business needs without requiring a complete overhaul.
Trial Periods and Demos:
Many tools offer trial periods or demos. Take advantage of these to get hands-on experience. This allows you to assess user-friendliness, features, and compatibility with your business requirements.
Community and Support:
Look into the user community and support options for each tool. A strong community often means a wealth of resources and shared knowledge. Assess the level of support provided by the tool’s developers or vendors.
Security and Compliance:
If dealing with sensitive data, prioritize tools that adhere to security standards and compliance regulations relevant to your industry. Ensure that the tools have robust security features to protect your data.
Read Reviews and Case Studies:
Learn from the experiences of others. Read reviews, case studies, and testimonials from businesses similar to yours. This can provide valuable insights into how the tools perform in real-world scenarios.
Remember, there’s no one-size-fits-all solution. Your ideal toolset might be a unique blend tailored to your business. So, embark on this tool-selection adventure with a clear vision, a sprinkle of curiosity, and the excitement of transforming your data into actionable insights.
Accelerate Your Data Journey with Syntax Technologies

As you embark on your exhilarating journey into data analytics, remember that each tool you master is a key that unlocks new insights and possibilities for your business.
Whether you’re crunching numbers in Excel, querying databases with SQL, or creating captivating visualizations in Tableau, the world of data is at your fingertips.
At Syntax Technologies, we understand that the learning curve for data analytics can be both thrilling and challenging. That’s why we’re excited to offer a comprehensive Data Analytics Course to accelerate your mastery of essential tools.
Imagine diving into the versatile world of Python, unlocking the power of SQL to interact with databases seamlessly, and crafting compelling visual narratives with Tableau.
Our course is crafted to empower you, whether you’re a beginner or looking to enhance your existing skills.
Join us at Syntax Technologies, where we believe in making the journey of mastering data analytics educational and enjoyable.
Let’s turn your curiosity into competence and transform your data dreams into reality!