Self-Paced Data Analytics Course

Data Analytics Self-Paced

Master Excel, SQL, Power BI, Tableau and Python through structured modules and build real dashboards and analyses for your portfolio.

Source: PwC AI Jobs Barometer 2026
≈4× faster
Data analyst demand
Data roles
+58%
Overall
+15%
+31%
Data-skills pay premium
With data skills
131
Comparable
100
Enroll todayInstant access
$1,999$4,199
Format100% self-paced
Access1 Year
SupportMentor & job-hunt help
PaymentPay in 3 instalments
Why most people stall

Watching data tutorials is easy.
Becoming a hireable Data Analyst is hard.

Learning alone
Scattered YouTube tutorials
Theory with no real practice
Copy-pasted scripts that break
No portfolio to show employers
Stuck with no one to ask
vs
Syntax Fellowship
A structured, ordered curriculum
Hands-on automation from day one
Frameworks you build yourself
Portfolio projects employers trust
Mentor & job-hunt support

Most people watch data tutorials.
Syntax grads ship dashboards and analyses.

What you get

Everything you need to get job-ready

01 · MASTER THE TOOLS

Industry tooling

Excel, SQL, Power BI, Tableau and Python — the exact stack hiring teams expect from a data analyst.

02 · SELF-PACED

Learn on your time

Structured modules with instant access. Study anytime, anywhere, and revisit lessons whenever you need.

03 · AI WORKFLOWS

The AI analytics edge

Use ChatGPT to write SQL, build DAX measures and speed up analysis — the edge employers want.

04 · JOB-READY

Real portfolio projects

Build dashboards and analyses you can showcase — proof you can do the job, not just a certificate.

The curriculum

From spreadsheets to job-ready insight

Eight structured modules. Tap any one to see what you'll learn, build, and practice.

01
Module 01

Excel Essentials

Start with the analyst’s most universal tool — Excel — and learn to manage, clean, analyze, and visualize data with confidence.

What you'll learn
Core functions — SUM, AVERAGE, IF, VLOOKUP, COUNTIF
Text, date & logical functions
Data validation, filtering & sorting
Pivot tables & charts for quick analysis
Learning outcomes
Clean and organize messy data
Summarize data with pivot tables
Build clear charts for everyday reporting
What you'll build
A working Excel analytics workbook

Turn raw data into a clean, pivot-driven report.

Tools you'll use
Excel
Career skills gained
ExcelPivot TablesData CleaningReporting
02
Module 02

SQL Foundations & T-SQL

Query and shape data at the source. Learn SQL from SELECT statements to advanced T-SQL for production-ready data work.

What you'll learn
SELECT, filtering, clauses, operators & functions
Joins, subqueries & window functions
Normalization & referential integrity
T-SQL: stored procedures, string & date functions
Learning outcomes
Retrieve and manipulate data with SQL
Write efficient, reusable T-SQL
Model and query relational databases
What you'll build
A query library over a real database

Answer real business questions with SQL.

Tools you'll use
SQL ServerMySQLPostgreSQL
Career skills gained
SQLT-SQLJoins & SubqueriesDatabase Design
03
Module 03

Power BI Dashboards

Turn raw data into interactive dashboards and data-driven stories that drive smarter business decisions.

What you'll learn
Power Query for data cleaning & transformation
Data modeling & relationships
DAX for calculated measures
Visuals, drill-downs, slicers & AI insights
Learning outcomes
Model data for analysis in Power BI
Write DAX measures
Ship interactive, decision-ready dashboards
What you'll build
An interactive Power BI dashboard

A live dashboard stakeholders can explore.

Tools you'll use
Power BIExcel
Career skills gained
Power BIDAXPower QueryData Modeling
04
Module 04

Tableau Storytelling

Transform complex data into meaningful, interactive visuals and dashboards that reveal insight at a glance.

What you'll learn
Connecting, cleaning & transforming data
Charts, maps, filters & calculated fields
LOD expressions, parameters & data blending
Interactive dashboards & data stories
Learning outcomes
Design impactful Tableau visuals
Build interactive dashboards & stories
Communicate insight to any audience
What you'll build
An interactive Tableau story

A guided visual narrative over real data.

Tools you'll use
Tableau
Career skills gained
TableauData VizDashboardsStorytelling
05
Module 05

Python for Data

Add programming to your toolkit — use Python and its data libraries to manipulate, analyze, and visualize data at scale.

What you'll learn
Python core — variables, loops, functions, dicts
Data manipulation with Pandas & NumPy
Filtering, grouping, joining & cleaning data
Visualization with Matplotlib + intro to ML
Learning outcomes
Wrangle data with Pandas & NumPy
Visualize trends with Matplotlib
Take your first steps into machine learning
What you'll build
A Python data-analysis project

Clean, explore & visualize a real dataset in code.

Tools you'll use
PythonPandasNumPyMatplotlib
Career skills gained
PythonPandasNumPyData Wrangling
06
Module 06

Data Engineering Foundations

Build the pipelines behind analytics — design and manage the data systems that feed dashboards and models.

What you'll learn
The role of data engineering & data warehouses
Moving data between SQL servers
Joins, derived columns & data flows
Merge joins, fact tables & CSV exports
Learning outcomes
Design and run data pipelines
Combine multiple data sources
Build scalable, reliable data systems
What you'll build
A working data pipeline

Move and transform data across systems end to end.

Tools you'll use
SQL ServerVisual StudioPython
Career skills gained
Data PipelinesETL / SSISData WarehousingSQL Server
07
Module 07

AI-Assisted Analytics

Work faster with AI — use ChatGPT across SQL, Power BI, and Python to accelerate insight and automate routine analysis.

What you'll learn
Why AI is essential for modern analytics
ChatGPT for SQL — generate, debug & optimize queries
ChatGPT for Power BI — DAX, modeling & visuals
ChatGPT for Python — faster EDA with Pandas
Learning outcomes
Speed up querying, modeling & EDA with AI
Debug and optimize code with ChatGPT
Stay competitive in an AI-driven field
What you'll build
An AI-accelerated analysis

Complete an analysis in a fraction of the time with AI.

Tools you'll use
ChatGPTPower BIPython
Career skills gained
AI for AnalyticsPromptingChatGPTAutomation
Final project

Capstone & Career Launch

Bring every skill together in a full-cycle capstone — then get portfolio, resume, and interview-ready to land the role.

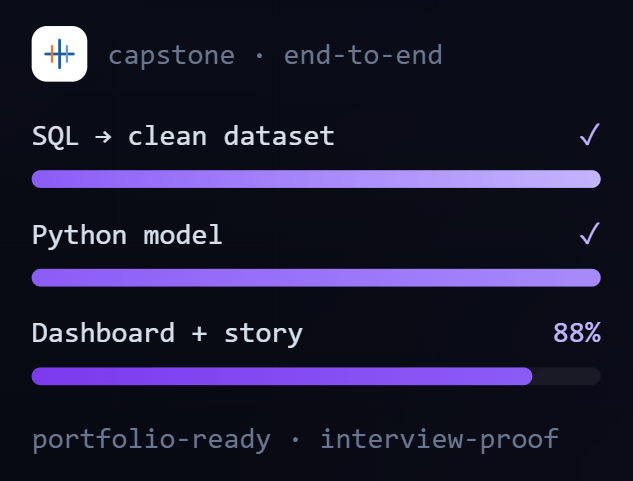
Full-cycle project — SQL, Power BI & Python
Storytelling, iteration & documentation
Portfolio, resume & LinkedIn polish
Mock interviews & job-search strategy

Download the complete module-by-module fellowship breakdown.

Download curriculum
What you'll have shipped

A portfolio of real analytics,
not a certificate.

Every phase ends with a finished analytics project you can add to your portfolio and walk into interviews with. Not slides. Not a tutorial you followed along to.

MONTH1
SQL query library
MONTH2
Power BI dashboard
MONTH3
Python analysis
MONTH4
Capstone portfolio

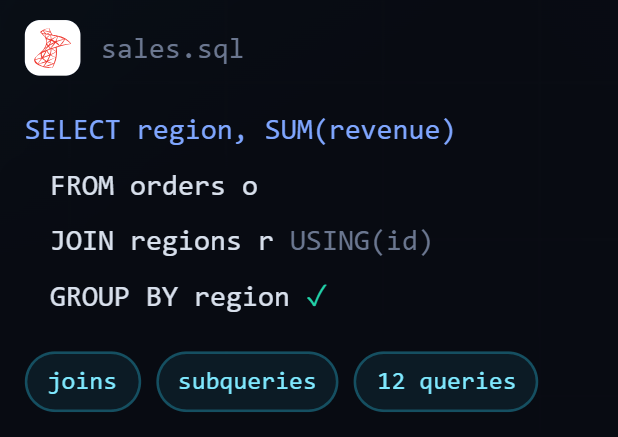
Answers pulled straight from data.

A library of T-SQL queries over a real database — joins, subqueries and aggregates that answer real business questions.

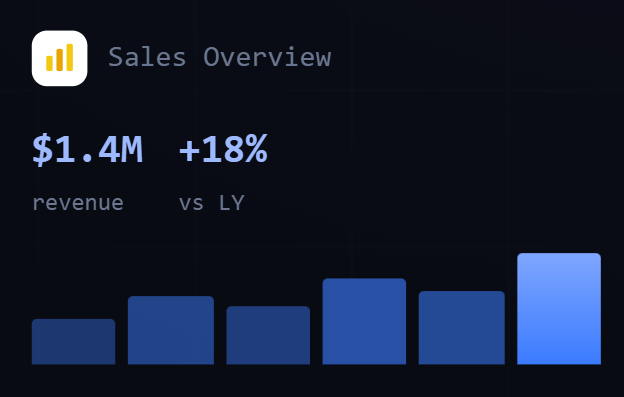
Dashboards stakeholders explore.

An interactive Power BI report with DAX measures and Power Query — a live dashboard decision-makers actually use.

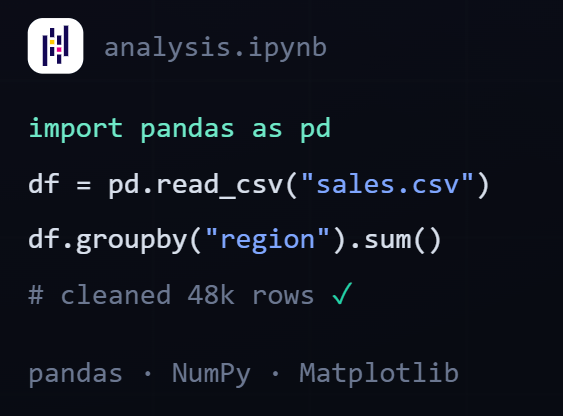
Analysis that scales in code.

A pandas + NumPy project cleaning, exploring and visualizing a real dataset — reproducible analysis far beyond spreadsheets.

An end-to-end BI portfolio.

A capstone that moves raw data through SQL, Python and Power BI/Tableau into a finished story — the proof you bring to interviews.

Career support

We support you from the first lesson to the job offer

Self-paced doesn't mean on your own. Here's how we help you get hired — at your own pace.

STEP 01
Learn by doing

Build real skills

Real-world projects, hands-on tools, and job-focused skills — built to fit your timeline.

STEP 02
Brand yourself

Craft your career profile

Resume & LinkedIn templates, portfolio guidance, and tips to stand out to recruiters.

STEP 03
Interview ready

Practice with confidence

On-demand mock interview vault, pre-recorded coaching, and insider question sets.

STEP 04
Job hunt support

Get hired — with help

Regular check-ins, email feedback, career-partner access, and placement opportunities.

MEET YOUR MENTORS

Learn from professionals

Pradeep Verma
Instructor
Pradeep Verma
Teaching Modules: SQL and Data Engineering
Ellie Stilwell
Mentor
Ellie Stilwell
Currently working as a Data Analyst in children’s hospital of Philadelphia in the foundation (fundraising branch)
Amy Reynolds
Mentor
Amy Reynolds
Currently working as a Data Analyst at a security company in Dallas
The AI advantage

Learn the AI tools powering
the future of automation testing

82% of data teams already use AI in their workflow — and analysts are next. This course doesn't just teach core analytics, it adds the AI edge employers are looking for.

AI + Testing = faster QA

Use AI tools to clean, query, and analyze data more efficiently — and reach insight faster.

Query smarter with AI

Generate SQL, build DAX measures, and speed up modeling with ChatGPT alongside your BI tools.

AI-enhanced coding

Use assistants like ChatGPT to write Python and Pandas, generate charts, and debug analysis on the fly.

Intelligent data analysis

Explore datasets, surface patterns, and prioritize findings by impact — with real-time AI insights.

Less guesswork, more insight

Combine traditional BI tools with LLM-powered solutions to go deeper and reduce manual effort.

Decide with confidence

Turn data into decisions responsibly — the edge we train you for as data grows.

Outcomes & results

Who this is for?

New to Data?Step into roles like Data Analyst, BI Analyst, or Analytics Engineer — with a portfolio of real dashboards and analyses to show.
Already Working?Lead data initiatives at your company with credibility and a track record of shipped, data-driven work.
Freelancer or Consultant?Offer analytics, reporting and dashboard services to clients — backed by projects you’ve built.
The Data Analytics course at Syntex Technologies is well structured and intensive. I appreciated having access to both live online sessions and recorded lessons, which made it easier to review the material. The homework assignments and additional self-study resources helped reinforce key concepts. Balancing the course with full-time work was challenging due to the volume of material, but we gained a solid amount of knowledge in a relatively short time.
Tetiana KrasnikovaTetiana KrasnikovaData Analytics
What's included

What you get with the course

Job-ready portfolio

Dashboards and analyses you build and can showcase to employers.

Mentor guidance

Feedback and support from experienced data-analytics mentors.

AI testing skills

The AI-assisted analytics edge employers are hiring for.

Job-hunt support

Resume help, interview prep, and placement assistance.

Certificate

A completion certificate backed by real projects.

Lifetime access

Revisit every module and future updates — forever.

Your credential

A certificate that proves what you built

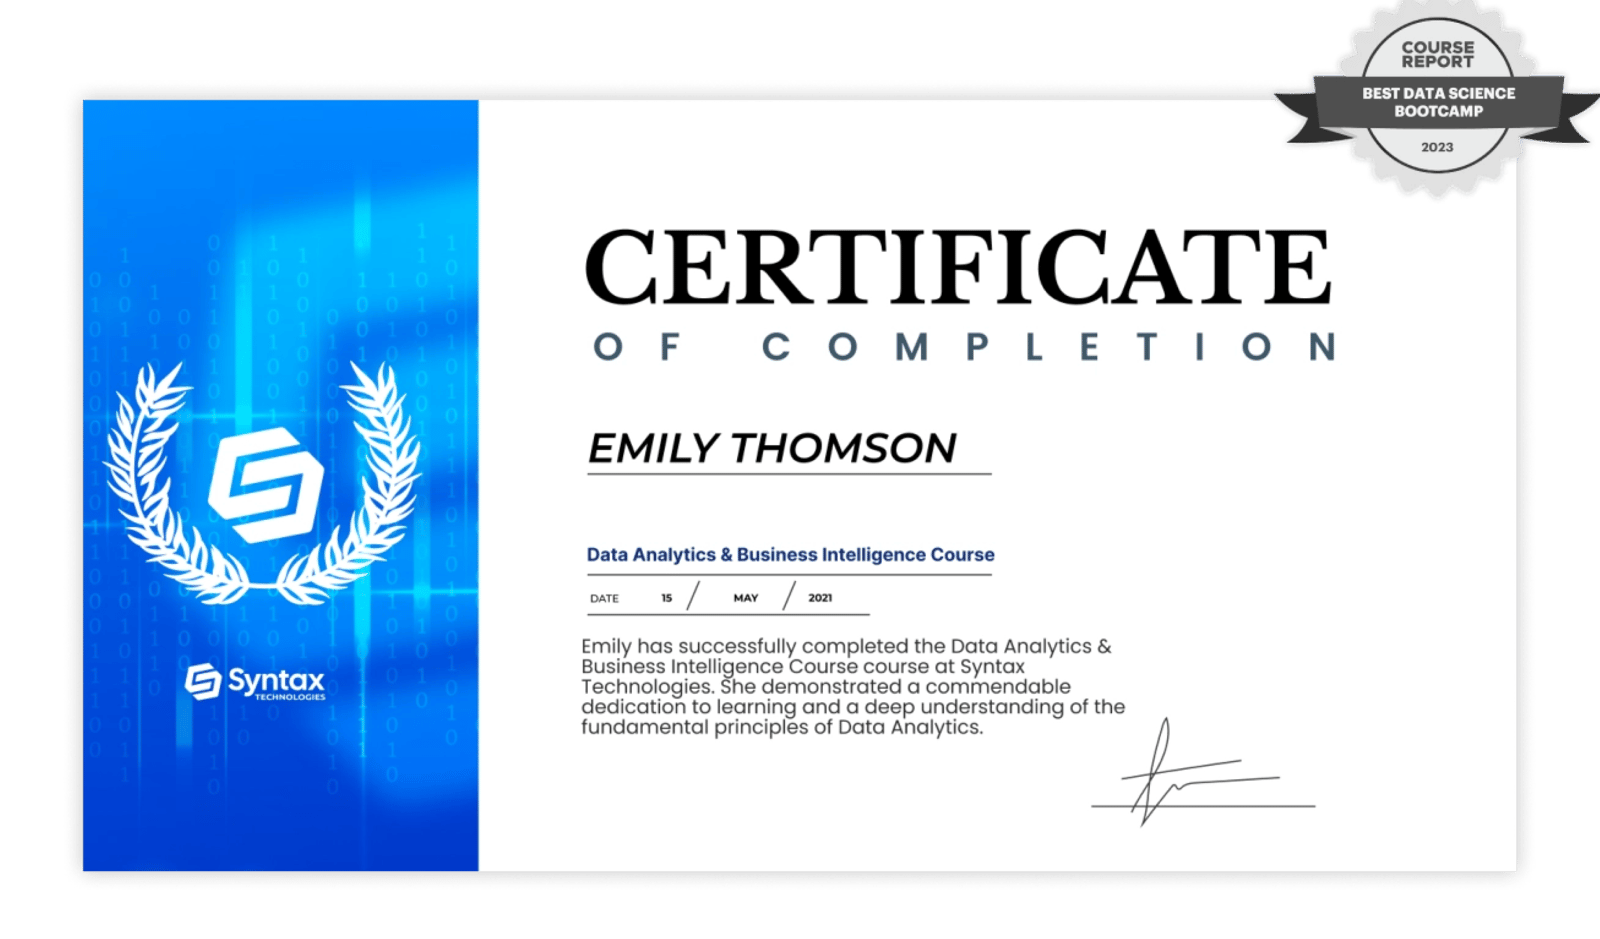
Finish the course and earn an official Syntax Technologies Certificate of Completion — a credential backed by the automation projects you build along the way.

Issued in your name with a verifiable completion date
Recognized by Syntax Technologies
Shareable on LinkedIn, your resume, and your portfolio
Syntax Technologies Certificate of Completion
Tuition

One price, flexible ways to pay

Your Investment

$4,199$1,999

One-time payment — full access, no hidden fees.

What's included
Full self-paced Data Analytics curriculum, instant access
Mentor guidance & project feedback
Hands-on automation projects for your portfolio
AI-assisted testing modules & tools
Resume, interview prep & job-hunt support
Lifetime access + completion certificate
Why learn with Syntax?

Four reasons professionals choose Syntax

DATA EXPERTS

Learn from data practitioners

Learn from mentors who work with data every day — SQL, Power BI, Tableau, and Python across real business problems.

HANDS-ON

Learn by Building

Complete hands-on projects, practical exercises, and real-world assignments that build a portfolio you can show any employer.

SELF-PACED SUPPORT

Support Beyond the Lessons

Get guided lessons, Q&A recordings, and an active community to support you throughout your learning journey.

FOUNDED IN 2017

Learn with confidence

We've helped learners build practical technology skills through structured, self-paced programs since 2017.

Common questions

Everything you’re wondering about

No. The course is beginner-friendly and starts from the fundamentals — Excel and SQL — before moving into Python and BI tools. Career switchers are welcome.

You get instant, lifetime access to every module and can learn anytime, at your own speed, and revisit lessons whenever you need.

The full analytics stack — Excel, SQL & T-SQL, Power BI, Tableau, and Python — plus using ChatGPT to speed up your analysis.

Yes. Every module ends in a hands-on project, and they combine into a capstone and a portfolio-ready BI project you can show employers.

Mentor guidance, resume & LinkedIn reviews, a completion certificate, and job-search support to help you land a role.

Yes. A 30-day money-back guarantee, no questions asked.

Self-Paced Data Analytics Course
Limited-time price — save $2,200 today