In today’s fast-paced world, data is all around us. It is present in every industry, telling us different stories about the market, customer preferences, and much more. It’s not just sufficient to collect data; it’s crucial to analyze it and derive insights from it. However, to convey these insights in a compelling, engaging, and memorable manner, we must master the art of storytelling with data.
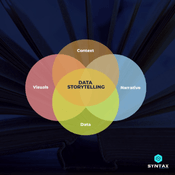
Data storytelling is the art of combining data-driven insights with compelling narrative to communicate complex ideas in a simplified and understandable way.
This blog post elaborates on why data storytelling is essential, how it can be mastered, and some best practices for its effective implementation.
Why is Data Storytelling Essential?
Data storytelling is essential because it allows us to effectively communicate complex ideas in a simplified and understandable way through a compelling story. By combining data-driven insights (extracted through data analysis) with compelling narratives, we can capture the audience’s attention and truly engage them in understanding the true value of the raw data.
Data storytelling bridges the gap between numbers and emotional connection, helping people access deeper understanding of facts and figures. It can also be used to help visualize the impact of certain decisions, allowing us to make more informed decisions when it comes to data-driven decision making.

Data storytelling provides a powerful platform to present important information in an engaging way, making it easier for our audience to understand and remember key insights. It makes data relatable.
Best Practices for Effective Storytelling with Data
Understand your audience
Understanding your audience is critical when it comes to data storytelling. It?s important to identify the key data points that are relevant to them and understand how they will use this information.
By thoroughly understanding the needs of your audience, you can create captivating data stories that effectively engage and resonate with them. Utilizing storytelling techniques in combination with data-driven insights allows you to create an engaging narrative that captures their attention and helps them truly understand the value of the information presented.
Analyze the data
Analyzing the data is essential for successful storytelling with data. It?s important to identify the data story that can be told from the data, and which data visualization best illustrate these stories.
By understanding the key insights and relationships in the data, you can create a narrative that helps bring those insights to light. Additionally, by looking at trends within the data, you can uncover hidden patterns and create compelling stories around them.
This process involves exploring the data to discover patterns, identifying trends, and understanding correlations between different variables. By analyzing the data, you can identify stories that are hidden within it and start to create a narrative around them.
Additionally, analyzing the data also enables you to draw meaningful insights from it that can be used to support your story.
Articles you may like:
“Data Visualization Examples: Good, Bad and Misleading“
Create a narrative
Creating an engaging narrative is essential for successful data storytelling. It should introduce the audience to the topic, explain why they need to know about it, and provide a compelling story that highlights the key insights from your data analysis.
Additionally, you can use various conventional tools and techniques of storytelling such as analogies, metaphors, and data visualization to make the story more engaging and easier to understand.
When creating a narrative, you should consider the following elements: ?A beginning ? Introduce the problem or challenge being addressed
?A middle ? Describe how you used data to solve it
?An end ? Present the outcomes and explain their significance

Use visuals to enhance the story
Visuals are an important component of effective data storytelling as they help in creating high impact visual stories. They allow us to present complex ideas in a simplified manner that?s easier for our audience to comprehend.
Furthermore, visuals can help bring our stories to life by providing context and making it easier for people to visualize the relationships between different elements of our stories.
As an important data visualization guide, it is important to remember that when selecting visuals, choose ones that are relevant and easily understood by our audience.
Additionally, it?s also important to ensure that the visuals accurately reflect the data being presented, communicate the message effectively and help bring the story to life in a powerful way.
Test your story
Testing different versions of your narrative is essential for successful data storytelling. It?s important to understand which version resonates best with your audience and how they will be able to use the information presented.
To test your story, you should present it to various audiences and ask for their feedback on the content, visuals, and overall effectiveness of the narrative.
By testing different versions of the story, you can identify which one works best in terms of engaging your audience and delivering key insights from the data.
Conclusion
Data storytelling is a powerful tool for communicating complex ideas in an engaging manner. By understanding our audience’s needs and analyzing the data, we can create compelling stories that capture their attention and deepen their understanding of key insights from our analysis.
Additionally, using visuals to enhance these stories can help make them more memorable and impactful. Ultimately, successful storytelling with data helps to engage with the audience on an emotional level, allowing business professionals to create meaningful connections with them.
We, at Syntax Technologies, help you develop expertise in the art of storytelling with data through our Data Analytics course. Enroll today.