


Welcome to the world where numbers become the secret sauce for making businesses shine.
We’re diving into the mix of data analytics and daily business operations a place where we turn raw data into smart moves with data mining.
We will analyze data from different places and use it to guide decisions in real-time turning analytics into the superhero language of business success.
So, imagine this as a journey where we mix numbers with action, and business data analytics isn’t just a sidekick but a real player in making your operations a hit.
Plus, if you’re keen on joining the ranks of skilled data analysts, it’s always best to take a data analytics course to pave your way to a successful business!
Buckle up for a ride into the world where numbers meet strategy, and let’s see the awesome things that happen when we blend data analytics with everyday business moves!
Get ready for the magic show!
How More Businesses are Relying on Analytics

Approximately 60% of global companies employ data and analytics to enhance process efficiency and control costs, as reported by MicroStrategy in 2020.
The increasing reliance on analytics in business has become a transformative trend, reshaping how organizations make decisions and navigate the complexities of their respective industries.
This statistic underscores the widespread recognition of analytics as a pivotal tool in driving strategic initiatives and gaining a competitive edge in the modern business landscape.
Businesses are no longer merely adopting analytics as a supplementary tool; instead, they are weaving it into the very fabric of their decision-making processes.
From optimizing supply chains to predicting customer behavior, the utilization of analytics has become synonymous with staying agile, informed, and forward-thinking in an ever-evolving market.
This shift reflects not just a technological evolution but a fundamental change in how businesses perceive and harness the power of data to shape their futures.
7 Benefits of Using Data Analytics in Business Operations

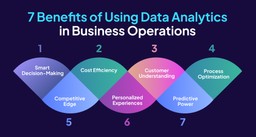
Want to know exactly how data analytics can benefit business operations?
Let’s dive into the 7 incredible benefits that make data analytics the ultimate sidekick for your everyday operations:
Smart Decision-Making:
Imagine having a trusty companion that guides you through decisions. With data analytics, you get just that! It helps you make more informed choices based on real insights, turning guesswork into strategic brilliance.
Cost Efficiency:
Who doesn’t love saving some green? Data analytics is like a financial wizard, helping you identify cost-effective strategies and optimize your operations. It’s not just about numbers; it’s about making every penny count.
Customer Understanding:
Ever wish you could read your customers’ minds? Data analytics gets you pretty close! It unveils patterns in customer behavior, letting you tailor your services and products to their preferences. It’s like having a conversation without saying a word!
Process Optimization:
Say goodbye to inefficiencies and hello to smooth sailing! Data analytics takes a magnifying glass to your processes, spotting bottlenecks and streamlining your operations. It’s your backstage pass to a seamlessly running show.
Competitive Edge:
Want to stay a step ahead of your competition? Data analytics is your secret weapon. It uncovers trends in the market, helping you adapt and innovate before anyone else. Consider it your crystal ball for staying ahead in the game!
Personalized Experiences:
Ever been impressed when a service knows exactly what you want? Data analytics is the magician behind that trick! It enables you to create personalized experiences for your customers, making them feel like VIPs. It’s all about making connections that matter.
Predictive Power:
Picture this: foreseeing the future of your business. Data analytics turns that into a reality! By analyzing past trends, it helps you predict what’s coming next. It’s like having a superpower for anticipating changes and staying prepared.
So, there you have it seven reasons why data analytics is a business’s not-so-secret weapon.
Get ready to unlock these benefits, and let data analytics be the superhero that propels operations to new heights!
Case Studies on how Data Analytics is Integrated in Business Operations
Now, let’s consider several fictional scenarios where you, a future or data analyst-in-the-making, can be used to change future outcomes into successful results.
Case Study 1: Retail Revolution
Background:
A leading retail chain, “SmartMart,” faced challenges in optimizing inventory, predicting customer preferences, and reducing operational costs.
Data Analytics Integration:
SmartMart implemented data analytics to analyze past sales, customer behaviors, and market trends.
They utilized predictive analytics to forecast demand, ensuring optimal stock levels. Customer purchase histories were analyzed to tailor promotions, enhancing customer engagement.
Results:
- Reduced stockouts and excess inventory, leading to a 15% increase in inventory turnover.
- Targeted promotions based on customer preferences increased sales by 20%.
- Streamlined supply chain processes, reducing operational costs by 12%.
Case Study 2: Tech Innovators
Background:
A technology company, “InnoTech,” wanted to enhance product development and improve customer satisfaction.
Data Analytics Integration:
InnoTech leveraged data analytics to analyze customer feedback, track product performance, and identify areas for improvement.
They utilized sentiment analysis to gauge customer satisfaction and sentiment towards their products. Additionally, they employed predictive analytics to anticipate potential product issues.
Results:
- Iterative product development based on customer feedback resulted in a 25% decrease in reported issues.
- Improved customer satisfaction scores by 18% through proactively addressing pain points.
- Used data insights to identify emerging technology trends, leading to the development of a successful new product.
Case Study 3: Financial Foresight
Background:
A prominent financial institution, “InvestWise,” sought to improve risk management, detect fraudulent activities, and enhance customer satisfaction.
Data Analytics Integration:
InvestWise employed data analytics to analyze transaction patterns, identify anomalies indicative of fraudulent activities, and predict market trends.
Customer interactions were analyzed to personalize financial recommendations, improving client satisfaction and loyalty.
Results:
- Reduced fraudulent transactions by 30% through real-time anomaly detection.
- Utilized predictive analytics for more accurate investment strategies, resulting in a 12% increase in portfolio returns.
- Tailored financial advice based on individual customer behaviors, leading to a 15% increase in customer satisfaction.
Case Study 4: Health Harmony
Background:
A healthcare provider, “WellCare,” aimed to enhance patient care, optimize resource allocation, and improve overall healthcare outcomes.
Data Analytics Integration:
WellCare implemented data analytics to analyze patient records, predict disease trends, and optimize resource allocation.
Predictive modeling was utilized to anticipate patient admission rates, enabling proactive resource planning.
Results:
- Reduced hospital readmissions by 25% through early identification of high-risk patients.
- Improved staff allocation and reduced wait times, leading to a 20% increase in operational efficiency.
- Utilized data insights to develop targeted public health campaigns, contributing to a 15% reduction in community health issues.
Case Study 5: Culinary Insights
Background:
A popular restaurant chain, “FlavorFusion,” aimed to optimize menu offerings, reduce food wastage and enhance the overall dining experience.
Data Analytics Integration:
FlavorFusion leveraged data analytics to analyze customer preferences, track menu item popularity, and optimize supply chain logistics.
Predictive analytics was employed to forecast demand and prevent overstocking.
Results:
- Adjusted menu offerings based on customer preferences, resulting in an 18% increase in overall sales.
- Reduced food wastage by 30% through better inventory management.
- Personalized dining experiences based on historical data, leading to a 22% improvement in customer satisfaction.
These additional case studies showcase the diverse applications of data analytics in finance, healthcare, and the food industry, demonstrating its impact on decision-making, operational efficiency, and customer satisfaction.
5 Main Data Analytics Tools Used in Business Operations
Tableau:
- Friendly Features:
- Easy-to-use interface for playing with your data no tech wizardry needed!
- Drag-and-drop magic to create dashboards that are as fun as they are informative.
- A buddy to all data sources, databases, and even cloud platforms it plays well with everyone.
- Cheers for:
- Data visualization is quick and snazzy visualization of complex data like turning numbers into a colorful story.
- Real-time data analysis made as easy as sharing a cat video.
- Helping teams across the board make decisions with a data high-five.
Microsoft Power BI:
- Friendly Features:
- It’s like the best friend of Microsoft Excel, and they’re always hanging out together.
- Connects with every data source out there the ultimate matchmaker.
- Makes data modeling and dashboard creation feel like a walk in the park.
- Cheers for:
- Being the life of the BI party, letting everyone in on the data insights disco.
- Sharing insights and reports like passing notes in class it’s that easy.
- Answering questions like a data-savvy buddy who knows all the cool tricks.
Google Analytics:
- Friendly Features:
- The go-to friend for understanding what’s happening on your website or app.
- Customizable reports and dashboards it’s your data, your way.
- It’s got the e-commerce tracking skills of a shopping buddy who knows all the best deals.
- Cheers for:
- Unveiling the mysteries of user behavior online like having a friendly chat with your website visitors.
- Keeping your online assets in check with performance insights your virtual guardian angel.
- Being the cool kid that effortlessly blends with other Google products and friends.
SAS (Statistical Analysis System):
- Friendly Features:
- A suite of tools that’s as welcoming as your favorite coffee shop.
- Handles big data like a champ no task is too big for SAS.
- The supportive friend who’s got your back with advanced analytics and modeling.
- Cheers for:
- Being the reliable buddy for organizations with a thirst for advanced analytics.
- Offering a toolbox of statistical and predictive modeling magic.
- Welcoming everyone to the SAS party with open arms.
Alteryx:
- Friendly Features:
- Your data’s best friend for blending and preparing it’s like a pre-analytics party!
- A drag-and-drop interface that turns the complex into the simple.
- The buddy that automates repetitive data tasks making your life easier.
- Cheers for:
- Being the behind-the-scenes hero who prepares and analyzes data effortlessly.
- Turning data tasks into a dance with automation.
- Mixing and mingling with various databases and cloud services like a social butterfly.
These data tools are not just tools; they’re like friendly companions in your data adventures, making the analytics journey as enjoyable as it is insightful
How to Get Started with Data Analytics for Business Operations

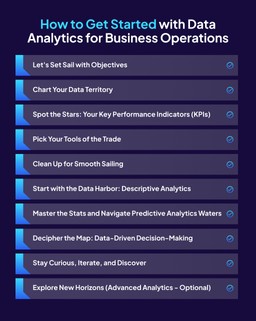
Embarking on a journey into data analytics for business operations can be both exciting and transformative. Here’s a step-by-step guide to help you get started:
Here’s your roadmap to kick off this exciting adventure:
Let’s Set Sail with Objectives:
First things first! Understand the lay of the land. What challenges are we aiming to conquer with data analytics? Whether it’s turbo-charging our processes, boosting customer satisfaction, or navigating cost-efficient routes, knowing our destination is key.
Chart Your Data Territory:
Time to get acquainted with our data landscape. Take a stroll through the data sources where they’re stored and how they connect. It’s like knowing the ins and outs of your favorite neighborhood before planning a grand exploration.
Spot the Stars: Your Key Performance Indicators (KPIs):
Every data explorer needs their North Star. Identify the KPIs that align with our business goals. These will guide us through the analytics constellations, helping us gauge our success as we chart new territories.
Pick Your Tools of the Trade:
Equip yourself with the right gear. For beginners, tools like Tableau or Power BI are like the trusty compasses of the analytics world. They’re user-friendly, visual, and perfect for those setting sail on this data adventure.
Clean Up for Smooth Sailing:
Before we set sail, tidy up the ship! Cleanse and prep the data. Think of it like getting the deck shipshape organized, spick, and span. This ensures we’re ready for smooth navigation and accurate insights.
Start with the Data Harbor: Descriptive Analytics:
Dip your toes in with descriptive analytics. Think of it as our data harbor a safe spot to understand historical patterns. Use charts, graphs, and summaries to get a feel for the waters before setting sail for deeper analytics seas.
Master the Stats and Navigate Predictive Analytics Waters:
Now, let’s dive into predictive analytics. Understand the currents of statistics, get cozy with regression analysis, and set sail into predictive modeling waters. It’s like becoming the captain of your own data ship, predicting where the analytics tides will take us.
Decipher the Map: Data-Driven Decision-Making:
Let data be your guiding star. Integrate data-driven decision-making into our daily operations. It’s like having a trusty map showing us the way to make informed choices and optimize our course.
Stay Curious, Iterate, and Discover:
The sea of data is vast, and curiosity is your compass. Stay curious, iterate on your findings, and discover new insights. This journey is about constant learning and uncovering the treasures hidden within our data.
Explore New Horizons (Advanced Analytics – Optional):
Ready for more challenges? Explore advanced analytics like prescriptive analytics or spatial analytics. It’s like setting sail for uncharted territories, discovering new horizons in the analytics seas.
A Guided Journey for Business Operations

Congrats! You’ve just embarked on an incredible journey into the seas of business analytics, ready to navigate operations like other business analysts with newfound insights.
Remember, every data point is a potential discovery, and your analytical skills are the compass that guides the ship.
As you chart your course through the waves of information, consider
enrolling in the comprehensive course offered by Syntax Technologies. This isn’t just a course; it’s your treasure map to mastering data analytics for business operations.
With a focus on practical skills, hands-on experience, and expert guidance, Syntax Technologies is your trusted companion on this data-driven expedition.