With Tableau Software, You can Connect to and Seamlessly Manage every Bit of Data that?s at Your Fingertips and Use it to Your Advantage.
Imagine yourself to be one of the board members of a business organization. In one of the board meetings, your co-member happens to share a report which appears as an extremely dull mathematical puzzle filled with numbers.
Simultaneously, another member shares a report which appears as a visually appealing document, filled with graphical presentation of data in the most comprehensible form. If the facts stated in both the cases are the same, which report will you prefer?
For most people, the answer will be the second one. This preference for a particular kind of Data Visualization as a part of the Business Intelligence process, is the answer to what is Tableau and to what is Tableau used for.
For a more detailed understanding of some of the best Business Intelligence Tools available in the market, refer to our blog on ?Top 10 Business Intelligence Tools?
In this blog, we shall consider the question of what is Tableau, consider its features and uses, look at its different products such as what is Tableau Public, what is Tableau Server and so on. Consequently, we shall also consider the question of what is Tableau CRM.
What is Tableau?
Tableau is a powerful data visualization and business intelligence tool that is commonly used in the field of data science. It is designed to help data scientists and analysts make sense of complex data sets by providing an intuitive interface to create interactive and visually appealing data visualizations.
With Tableau, data scientists can quickly connect to various data sources, including databases, spreadsheets, and cloud-based platforms, and explore and analyze data using a range of statistical and visual analysis tools.
They can create interactive dashboards and reports that allow them to identify patterns and trends, explore relationships between variables, and communicate their insights effectively to stakeholders.
In addition, Tableau provides a range of features that are specifically designed for data scientist, such as machine learning algorithms, advanced analytics capabilities, and real-time data processing. These features allow data scientists to uncover insights that might be missed by traditional analytics tools and to work more efficiently and effectively within the field of data science.
Overall, Tableau is a powerful tool for data scientists and analysts who need to explore, analyze, and communicate complex data sets. It enables data scientists to create insightful visualizations and dashboards that can be used to inform critical business decisions and to help organizations gain a competitive edge in today’s data-driven economy.

Apart from working on all kinds of data, Tableau facilitates its usage by people from non-technical backgrounds as it doesn?t necessarily require the knowledge of programming languages for its operation. Consequently, Tableau provides for Data Blending, Data Collaboration as well as Real Time Visual Analytics.
As one of the leading tools, Tableau faces stiff competition from another prominent platform and that is Power BI. If you wish to know more on the debate on Power BI vs. Tableau; check out our blog on ?Power BI vs. Tableau?
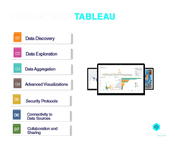
What is Tableau Software?: Prominent Features
In this section, we will look at some of the important features of Tableau.
- Tableau provides for Data Discovery and Data Exploration which helps in resolving given queries
- Tableau helps in Data Aggregation as it can connect to different data sources and thus help in blending diverse datasets
- Tableau does not make knowledge of programming language mandatory for its operation
- It provides for Advanced Visualizations as well as Collaboration and Sharing
It facilitates Mobile as well as Licensing View, along with Revision History?

What is Tableau Used For?: Working of Tableau
In this section, we shall look at the functioning of this tool by considering what is Tableau used for.
- Tableau facilitates the extraction of data from different places. One of the biggest advantages of Tableau is that it can provide for the collection of data from any database, be it, excel, pdf, Hadoop, Python, SAS; or cloud database like Amazon, Netflix, Flipkart; or complex databases like Oracle.
- The collected data is then siphoned off to Tableau?s data engine which is called the Tableau Desktop. This is the junction where Data Analysts indulge in Data Analysis and develop Data Visualization. The dashboards so created are then shared with different users on Tableau Reader.
- In the next stage, data is published on Tableau Server. It is the platform which supports automation features as well as provides for governance, collaboration and distribution of data.
- Consequently, the end users will be able to access the reports from all locations.
Tableau Product Suite
As you try to answer the question of what is Tableau, it is important to remember that it is not a single entity. It comprises different products and each of its products serves a specific function. These products can further be classified into two categories on the basis of what is Tableau used for. Accordingly we have,
Developer Tools
These tools include Tableau tools which are used for the generation and development of reports, dashboards, different types of visualizations and so on. This category would include Tableau Public and Tableau Desktop.
Sharing Tools
These tools include Tableau tools which facilitate the sharing of the reports, dashboards and visualizations which have already been created with the help of the Developer Tools. This category would include Tableau Reader, Tableau Online and Tableau Server.

What is Tableau Public?

As the name suggests, Tableau Public is available for use by everyone and is essentially for those who want to opt for a free version of the tool. The workbooks and sheets created here cannot be saved locally and need to be saved to public cloud in Tableau Server. Consequently, it is available for use by everyone.
There is no specific privacy setting and the files are open for download to anyone who would like to access them. This version of the tool is especially for those who want to learn Tableau or want to share their data with the general public.
What is Tableau Server?

Tableau Server acts as the medium for the sharing of Data Visualization, workbooks and sheets which are created on Tableau Desktop. However, it is important to remember that one will be required to publish their work on Tableau Desktop, before they can share it on Tableau Server. Once it has been uploaded on the server, it will be available for access to restricted licensed users. The licensed users simply require the login credentials with which they will be able to access the reports. Thus, in trying to understand, what is Tableau Server, you should remember that this version of the tool provides for strong privacy settings and is useful for effective dissemination of data across an organization.
What is Tableau Desktop?
Tableau Desktop can be considered to be an extremely useful tool as it provides functionalities which help in creating graphs, charts and reports, thus forming dashboards. Hence, it helps to customize and modify reports.
The end products so created can be shared locally or publicly. Additionally, for the purpose of live data analysis, it also provides connectivity to Data Warehouse. In trying to understand, what is Tableau Desktop, you should remember that this version of the tool is largely of two types:
Tableau Desktop Personal
This is largely used for private mode. This implies that the workbooks cannot be shared publicly and it provides limited access. The workbooks can only be distributed in Tableau Public or Offline.
Tableau Desktop Professional
It provides the same features as Tableau Desktop. The only point to remember is that in case of Tableau Desktop Professional, the workbooks created can be published in Tableau Server or online. It provides full fledged access to all datatype.
What is Tableau Reader?
As the name suggests, Tableau Reader serves a specific purpose. It helps in viewing Data Visualizations and workbooks which were created through Tableau Public or Tableau Desktop. It allows for filtering and refining of data, but not for modification or editing. It does not provide for any extra layer of security and any individual who has access to the workbook, can read it on Tableau Reader.
What is Tableau Online?
This acts as an Online Sharing Tool. It is much similar to Tableau Server; however, in this case, data is saved on servers, arranged on cloud and maintained by the Tableau group. There is no storage limit of data which is published on Tableau Online. Tableau Online helps to create direct links with multiple data sources which are hosted in the cloud such as Spark SQL, Hive, Amazon Aurora, MySQL and so on.
What is Tableau CRM?
There has been a rapid increase in the volume of data over the years. This implies that it has become nearly impossible to analyze all this data manually. Tableau CRM, which was previously known as Einstein Analytics, emerged as a remedy to address this problem.
It is an Artificial Intelligence (AI) driven Analytics platform which can work with any kind of data source. Thus, Tableau CRM helps in analyzing huge volumes of data, dealing with complex combinations of data and consequently providing prescriptive recommendations and predictive insights.
In trying to understand, what is Tableau CRM, you should remember that this version of the tool helps in conducting analytical processes in marketing, sales, service and so on, which could guide business decision making.
Benefits of using Tableau
The answer to the question of what is Tableau is incomplete without acknowledging it as the first choice as far as Business Intelligence Reporting Tools are concerned. In this section of the blog, we shall look at some of the advantages of using Tableau.
- User-friendly interface: Tableau provides a user-friendly interface that enables users to quickly create and customize data visualizations and dashboards without extensive coding or programming knowledge.
- Interactive visualizations: Tableau allows users to create interactive visualizations that enable them to explore data, uncover insights, and communicate findings effectively.
- Integration with multiple data sources: Tableau can connect to a wide range of data sources, including spreadsheets, databases, and cloud-based platforms, making it easy to access and analyze data from different sources.
- Real-time data processing: Tableau can process and visualize real-time data, making it easy to monitor and respond to changes in data as they occur.
- Advanced analytics capabilities: Tableau provides advanced analytics capabilities, including machine learning algorithms and predictive modeling, allowing users to uncover insights and make data-driven decisions.
- Mobile compatibility: Tableau’s mobile compatibility enables users to access data visualizations and dashboards from anywhere, on any device, allowing for increased flexibility and productivity.
- Collaboration and sharing: Tableau allows users to share visualizations and dashboards with others, collaborate on data analysis, and provide feedback, enabling effective team collaboration.
- Easy to scale: Tableau can be easily scaled up or down, depending on the needs of the organization, making it a cost-effective solution for businesses of all sizes.
- Comprehensive support: Tableau offers comprehensive support to users, including a range of training materials, online forums, and a global community of users who can provide guidance and support.
- Customizable dashboards: Tableau enables users to create customized dashboards that are tailored to their specific needs, allowing them to focus on the metrics and insights that are most relevant to their business.
- Data Exploration: Tableau not only helps in looking at data from different angles, but also helps in hypothetically viewing it in an entirely different manner by adding new components for the purpose of analysis and comparison.
- User-friendly: Tableau is well-suited for individuals who happen to lack coding experience or a purely technical background. Its intuitive UI and drag-and-drop functionalities are incredibly simple to use.
- Tableau offers the option of switching between different forms of data visualization, which in turn helps in detailed analysis and exploration of data.
Conclusion
As you try to understand what Tableau is used for; it is quite evident that the purpose of this tool goes much beyond one function. Apart from fantastic Data Visualization, Tableau also helps in customising and coding reports. It provides reliable, accurate and swift results.
It surpasses Excel in quite a number of aspects like generating interactive dashboards, handling huge volumes of data and so on. As a business individual, if you happen to be someone who is constantly in search for valuable insights to give your organization, the necessary push; Tableau becomes indispensable.
Data Analytics and the representation of derived insights from those data in visually appealing forms, have become crucial for business organizations across sectors. Developing expertise in the field of Data Analytics or Business Intelligence entails the need to be well versed with the usage of Data Analytics Tools, of which Tableau is a prominent one.
We, at Syntax Technologies, offer you an exciting opportunity to become a Data Analytics and BI expert. Check out our Data Analytics and Business Intelligence course.