


Big Data Analytics is the backbone of modern businesses. Companies use these analytics to make data-driven decisions that lead them towards success. There are plenty of tools available in the market to help you achieve your data analytics goals. However, Looker and Tableau are the most common platforms for business intelligence and data analytics.
In this blog post, we shall take up the topic of “Looker vs. Tableau” by exploring the strengths and weaknesses of both, to help you make an informed decision about which one to use.
Overview of Looker and Tableau
Looker is a modern business intelligence platform that enables its users to explore their data from any angle. It helps create visualizations, surfaces insights, and makes sense of the data at hand. Furthermore, Looker allows you to build custom applications for your organization with its user-friendly interface.

Tableau on the other hand, is a data visualization platform that enables its users to create simple and complex visuals in an interactive manner. It helps you transform your raw data into insightful information within minutes. Tableau also offers tools like forecasting, trend lines, and correlations that help make better business decisions quickly.

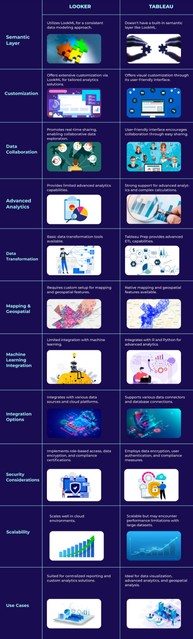
Looker vs. Tableau: A Tabular Comparison
Looker:
Pros:
- Semantic layer (LookML) for consistent data modeling.
- Extensive customization options via LookML.
- Collaboration-friendly with easy sharing.
- Cloud-based deployment for scalability.
- Active user community and resources.
Cons:
- Steeper learning curve due to SQL and LookML.
- Limited advanced analytics capabilities.
- Basic data transformation tools.
- Geospatial features require custom setups.

Tableau:
Pros:
- User-friendly drag-and-drop interface.
- Strong advanced analytics support.
- More advanced data transformation (Tableau Prep).
- Native mapping and geospatial features.
- Robust user community and resources.
Cons:
- Performance limitations with large datasets.
- Potentially higher licensing costs.
- Some data sources require extra preparation.
- Customization options might be more limited.

Tableau vs. Looker: Cost Comparison
When it comes to cost considerations between Looker and Tableau, it’s important to note that they follow different pricing models. Looker has a usage-based and features-based pricing model. This means the overall cost will depend on the scale of your operations and the features you opt for. It provides flexibility and can be a cost-effective solution for SMEs.
Tableau, on the other hand, follows a licensing and subscription-based model. Businesses need to purchase licenses to access the software, and there’s an annual subscription fee for continued usage.
The cost might be higher compared to Looker, but Tableau offers a comprehensive set of advanced features which may justify the investment for large enterprises with complex data visualization needs.
It’s crucial to understand the nature of your business, the complexity of your data, and the scale of your operations before deciding which platform to opt for.
Ease of Use: Which one is Easier to Learn and Use?
Tableau is often deemed more user-friendly due to its intuitive, drag-and-drop interface. Users without programming experience can easily create compelling visualizations. Tableau’s learning curve is shorter, which means users can quickly get up to speed and start creating meaningful reports.
Looker, on the other hand, utilizes a SQL-based user interface and requires knowledge of its proprietary language, LookML, for data modeling. This leads to a steeper learning curve. However, once mastered, LookML allows for extensive customization and fine control over data presentation and analysis, which can be a significant advantage for users comfortable with coding.
In conclusion, Tableau might be easier for beginners or non-technical users, while Looker may be better suited for users who prefer a more hands-on, code-driven approach to data analytics.

Looker vs. Tableau: Security considerations
Looker, as part of the Google Cloud platform, benefits from Google’s extensive security infrastructure. It offers features such as SSO and 2-factor authentication, and adheres to stringent security standards, including SOC 2 Type II, GDPR, and more. Furthermore, with its cloud-based deployment, data stored in Looker is continuously backed up and protected against disaster scenarios.
Tableau, now a part of Salesforce, also offers robust security features to protect sensitive data. It provides options for role-based security, data encryption at rest and in transit, and supports SSO and Active Directory integration. Users can also set data access at different levels (data source, project, workbook, and view), providing granular control over who sees what.
In conclusion, both platforms take data security seriously and provide comprehensive measures to guarantee the safety of your data.
Identifying the Best Use Cases for each platform
Best Use Cases for Looker:
- Centralized Data Reporting: Looker’s semantic layer and easy sharing make it great for creating consistent, shareable reports and dashboards across the organization.
- Custom Analytics Solutions: Looker’s extensive customization capabilities (LookML) are ideal for building tailored analytics solutions for specific business needs.
- Data Collaboration: Looker’s collaborative features suit teams that require real-time collaboration on data exploration and insights.
- Agile Data Exploration: Looker’s SQL-based approach is useful for data analysts who prefer to work with code and query data directly.
- Scaling Cloud Analytics: Looker’s cloud-based deployment makes it a good choice for businesses looking to scale analytics in the cloud.
Best Use Cases for Tableau:
- Data Visualization and Exploration: Tableau’s user-friendly interface is excellent for creating interactive visualizations and exploring data.
- Advanced Analytics: Tableau’s robust support for calculations, statistical analysis, and integration with R/Python makes it suitable for advanced analytics projects.
- Geospatial Analysis: Tableau’s native mapping and geospatial features make it well-suited for location-based data analysis.
- Quick Insights: Tableau is great for users who want to quickly create visualizations without deep technical expertise.
- Ad-Hoc Reporting: Its drag-and-drop capabilities are ideal for business users who want to generate reports without writing code.
Articles you may like:
?Google Sheets vs. Excel: A Head-to-Head Comparison?
?Google Data Studio vs Power BI?
Conclusion
In wrapping up, the choice between Looker and Tableau ultimately boils down to your specific business needs and the skill sets of your team. Looker, with its code-driven approach and customizable features, is an excellent choice for those who prefer hands-on data manipulation and have a knack for SQL.
On the other hand, Tableau’s intuitive interface and robust visualization capabilities make it an ideal solution for businesses seeking to generate compelling insights quickly, with minimal technical expertise.