Data will talk to you, if you’re willing to listen – Jim Bergeson (Vice-President-Division at BI WORLDWIDE)
Data is being generated at an unimaginable rate across the globe. But what do you do with that data? You can either leave it untouched or you can use it for deriving insights. This idea of using data is considered to be the driving engine of modern society.
Thus, the above mentioned quote implies that data speaks to us, provides us with valuable information, only if we are able to derive that information (listen to it) with the help of the right kind of Data Analytics tools.
There are numerous tools for Data Analytics being present in current times. The choice of opting for the best kind of data analysis tool, is likely to be driven by a number of factors. In this blog, we will try to answer some common questions surrounding Data Analytics tools and techniques as well as try to look at 10 of the most popular Data Analytics tools.
What are Data Analytics Tools?
Simply put, Data Analytics tools refer to the applications and software which help in carrying out the process of Data Analytics. Data Analytics is the process of analyzing data with the objective of deriving valuable insights from it which could help in business decision making, in predictive analytics, as well as in exploratory data analysis. This analytical process is made possible with the help of Data Analytics tools and techniques.
Acquire a more detailed understanding of the field of Data Analytics; check out our blog on “What is Data Analytics?“
Why are Data Analytics Tools and Techniques Important?
We will try to understand the importance of the tools for Data Analysis with the help of a simple example from our daily lives.
Consider a situation where you perform a random online search for a particular brand of shoes or you search for a specific location which happens to be your dream vacation spot. You read about this brand and you gather information about this place.
Next, you log into your social media account, say Facebook. You witness advertisements of the same brand or the particular holiday location. It seems that the social media platform is reading your mind. How is this made possible?
The answer lies in data analysis and analysis of information collected from your search history. Your search is tracked and this helps in tailoring the content visible on your Facebook account as per your interests.
The point is that it is the Data Analysis tools and techniques which help in exploring this world of the hidden. Thus, the importance of Data Analytics tools is largely in terms of their assistance in facilitating the process of Data Analytics, which then again has a positive impact upon business growth and productivity through data-driven decision making.
How to Choose Tools for Data Analytics?
The Data Analytics tools form an important part of the modern business process. However, choosing the right kind of tool can be a challenging task.
There can be several queries running in your mind on issues such as the competitiveness of the tool, the ease of using it, its position within the market as well as the expenditure which would be incurred in its ownership.
Furthermore, there are open source Data Analytics tools as well as paid versions and the user has to decide upon the most suitable one depending on his need.
Open Source Data Analysis tools have emerged as being extremely popular, performance oriented and user-friendly than the paid versions as many of them do not require coding as a prerequisite and have managed to produce better outcomes than the paid versions.
Thus, there is no shortage of Data Analytics tools; however, there can still be certain factors which can be considered while making the choice for a particular data analysis tool.
In the first place, you need to take into account the requirements of your Company. The choice of tool will be dictated by the needs of the organization.
The second consideration would be the profile of the individuals who are supposed to use the tool. You can consider factors like whether the users would be experts and professionals like Data Scientists and Data Analysts or whether they would be non-technical users.
This is important because some of these Data Analytics tools might entail code creation, while some are designed with a simple interface with point-and-click analysis which is appropriate for freshers and less technical users.
Another point of consideration can be whether the tools for Data Analytics are capable of data preparation and data modeling. Some of these tools are capable of doing so and if they are not, then one can go with Data Analytics tools like Data Build Tool (dbt) or SQL, which are capable of modeling data before subjecting them to analysis.
In the last, one should take into account issues such as pricing of the tools. Some of these tools are open source Data Analytics tools, most of which are free; while some of them have subscription or license charges.
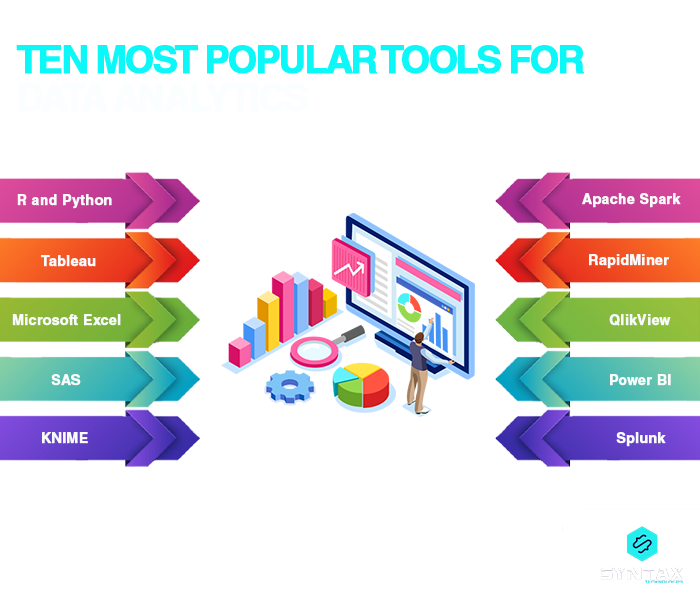
10 Most Popular Data Analytics Tools
In this section, we will explore 10 most popular tools for Data Analytics which can be extremely useful.
1. R and Python

R is one of the most popular data analysis tools which is used for data modeling and statistics. It is an open source Data Analytics tool and has surpassed SAS, when considering issues like outcome, performance and capacity of data. Python is an object-oriented, interpreted programming language, is open source and is easy to maintain, read and write.
Features of R:
- It is one of the prime programming languages which is used for data analysis and statistical modelling
- It is free and an open source Data Analytics tool
- It has great consistency and syntax, but requires some knowledge of coding
- It is useful for Data manipulation and Data visualization
- It can run on a number of different platforms and is supported by a huge community of developers
Companies using R:
Google, Uber, Facebook, Firefox, Twitter, ANZ
Features of Python:
- It is one of the fastest evolving programming languages
- It is an open source, free software, which is easy to learn as it is quite similar to PHP, JavaScript and Ruby
- It can be assembled on any platform and is efficient in handling text data
- It has a commendable set of libraries, Pandas being extremely famous
- Python is widely used and is supported by a huge community of developers
Companies using Python:
Google, Netflix, YouTube, Spotify
2. Tableau

It is considered to be one of the most easily understandable and best Data Analytics tools, which is efficient in analyzing data as well as producing data visualizations. It can work on live data-set and produce reports which can be shared across mobile and desktop platforms, embedded in an application or within a browser.
Features of Tableau:
- It is primarily used by Data Analysts for analyzing, understanding and visualizing data
- It is easy to learn, to be deployed and is user-friendly
- It provides fast analytics and is competent in exploring different kinds of data
- The Tableau family includes the following products: Tableau Public, Tableau Desktop, Tableau Online, Tableau Server and Tableau Reader. Among these Tableau Public is a free software
Companies using Tableau:
LinkedIn, Citibank, Skype, Amazon
Tableau is an increasingly fascinating Data Analytics as well as Visualization tool. Know more about its features; check out our blog on “What is Tableau?: Learn from the Basics“
3. Microsoft Excel


It is one of the most common and basic tools for Data Analytics. It is capable of supporting any standard analytics workflow and provides users with the option of real time collaboration, importing data directly from pictures, sharing of workbooks and so on. One important limitation of Excel is that it is not considered to be competent for analyzing Big Data.
Features of Excel:
- It is a spreadsheet and a powerful tool for the collection and analysis of data
- Its products fall under three groups: for home, for enterprises and for business. Some of the versions are available for a month for free. On the whole, Excel is not free
- It is user-friendly, easy to learn and does not require UI to enter data
- Microsoft Excel?s ToolPak feature provides a numerous choices for executing statistical analysis of data
Companies using Excel:
Users of Microsoft Excel can be found in almost all organizations across the globe. Some of the prominent names are Marriott, IKEA and McDonald?s.
4. SAS
It is a statistical software suite which has been popularly used in the fields of predictive analysis, Business Intelligence and data management. It is easy to access and manage and can analyze data irrespective of the source from which it originates.
Features of SAS:
- It brought in a number of products and introduced modules for marketing, web and social media analytics which helps in customer profiling
- It a proprietary software and hence it is paid
- It is easy to learn and has a simple GUI
- The Visual Analytics Software of SAS is efficient in producing interactive dashboards, self-service analytics, BI, smart visualizations and text analytics
- It is comprehensively used in weather forecasting and pharmaceutical industry
Companies using SAS:
Netflix, Google, Twitter, Facebook. It is used for clinical research reporting in Covance and Novartis.
5. KNIME

KNIME stands for Konstanz Information Miner. It is an integrated, reporting, free and open source Data Analytics tool which helps in data processing, reporting, integration and visualization. It provides for the integration of Data mining libraries and Machine Learning with no specific programming requirements.
Features of KNIME:
- In terms of its products, KNIME offers two software: KNIME Analytics Platform and KNIME Server
- The KNIME Analytics platform is an open source tool which can be used to collect data and create Data Science workflows
- The KNIME Server can be seen as a platform which is used by enterprises for team collaboration, automation and management and deployment of Data Science workflows
- The GUI provides for point-and-click analysis and data modelling
Companies using KNIME:
Novartis, Siemens, Continental, Deutsche Telekom.
6. Apache Spark

Apache Spark is one of the prime projects within the Apache Software Foundation. It can be seen as an open source Data Analytics tool which is highly efficient in real time processing. The foundation of Apache Spark is Data Science and it is competent in analyzing huge amounts of data, along with unstructured ones. It provides for easy integration via the Hadoop ecosystem.
Features of Apache Spark:
- It is an integrated analytics engine, a cluster computing framework for Big Data processing
- It is free and an open source Data Analytics tool
- It is an easy to learn tool and can be interactively used via the shells of Python, SQL, Scala and R
- It can run on multiple platforms like Apache Mesos, in the cloud, Hadoop or standalone
- It includes number of libraries: MLlib ? Machine Learning; GraphX ? Graph analytics; SparkStream ? Live dataStream processing
Companies using Apache Spark:
Slack, Uber, Visa, Oracle, Shopify, Verizon.
7. RapidMiner

This tool has been hailed as the visionary tool for Data Analytics by Gartner. It can be seen as a platform which can be put to multiple usage including data processing and deployment as well as Machine Learning models.
It is a wholesome tool which provides all facilities that one would need in order to proceed with data integration, data cleaning as well as data transformation, before they execute predictive analysis and statistical models.
Features of RapidMiner:
- It provides a simple GUI
- It can be extended using Python and R scripts and different third party plugins available
- Its products include: Server, Studio, Radoop, GO and Real-Time Scoring
- The tool can be incorporated with any type of data source including Oracle, Access, Ingres, Excel, Tera Data, MySQL and so on
Companies using RapidMiner:
Hewlett Packard Enterprise, BMW, Sanofi, EZCater.
8. QlikView

This has been regarded as a Data Visualization, Self-Service Business Intelligence and Data Analytics tool. It aims to bring in gains for a business enterprise through providing features like Data Analytics, Data Integration and Data Literacy.
Features of QlikView:
- It has some unique features like in-memory data processing and patented technology which helps in guaranteeing fast execution of results to the users
- It provides multiple products and services for Data Analytics, Integration and Developer Platforms, few of which are available for a free trial period lasting for 30 days
- It helps in data discovery and exploration by all kinds of users
Companies using QlikView:
SAMSUNG, CISCO, KitchenAid, NHS.
9. Power BI

This is another powerful Business Intelligence tool by Microsoft. The distinguishing feature of the platform is its self-service Business Intelligence capabilities and interactive visualizations. Users have the option to produce reports and create dashboards, without having to rely upon anyone.
Features of Power BI:
- It offers the following products: Power BI Desktop, Power BI Premium, Power BI Pro, Power BI Embedded, Power BI Mobile, Power BI Report Server
- It provides for integration with other tools, like Microsoft Excel
- It supports multiple data sources and can be used to share the outcomes across organizations
- It helps in creating and implementing automated machine learning models
Companies using Power BI:
Ecolab, Adobe, Nestle, Heathrow, Tenneco, Worldsmart.
10. Splunk

It is quite a popular Data Analytics tool and is extensively used for searching, analyzing and visualizing data from multiple sources. It began as a platform whose primary purpose was to process machine log files data. However, it has broadened in scope as it provides the option to perform all sorts of statistical analysis and present it in the most interactive form.
Features of Splunk:
- The main products offered under the Splunk family are: Splunk Free, Splunk Cloud and Splunk Enterprise
- The three products differ from each other on the basis of the range of features which each offers, can freely be downloaded and comes with trial versions
- The pricing of the products are based on rapid adoption packages, predictive pricing and infrastructure based pricing
Companies using Splunk:
Lenovo, Dominos, Intel, Otto Group.
Conclusion
I am sure that by the end of this blog, you must have acquired a good understanding of some of the most popular Data Analytics tools and techniques. It is important to note that this list is by no means complete. This means that there are a number of Data Analytics tools beyond those covered here.
The purpose of this blog was to provide you with a fair understanding of the best ones among the many. Opting for the right one can be a real challenge, but with appropriate information and proper research, you can definitely arrive at the best choice for your organization.
We, at Syntax Technologies, provide you with an amazing opportunity to acquire hands-on learning experience in the different programming languages and tools covered under our Data Analytics and Business Intelligence course.