??The Goal is to Turn Data into Information, and Information into Insight? – Carly Fiorina (Former CEO of Hewlett-Packard)
Data Analytics has emerged as one of the central aspects of business operations. Consequently, the quest to grab professional positions within the Data Analytics domain has assumed unimaginable proportions. So if you too happen to be someone who is desirous of making it through a Data Analyst interview, you have come to the right place.
This is because; in this blog we will provide you a list of 30 important Data Analyst Interview Questions, along with their answers; which would be extremely helpful as you prepare for your interview. This list of Interview Questions for Data Analysts focus on some of the most important areas that you must pay attention to as you prepare for your interview.
For a more detailed understanding of the topic, check out our blog on ?What is Data Analytics??
For the purpose of convenience, this blog has been divided into three parts and covers the top 30 Data Analyst Interview Questions and Answers.
Entry Level Data Analyst Interview Questions
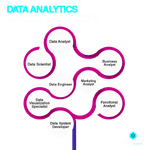
1. How do you become a Data Analyst??
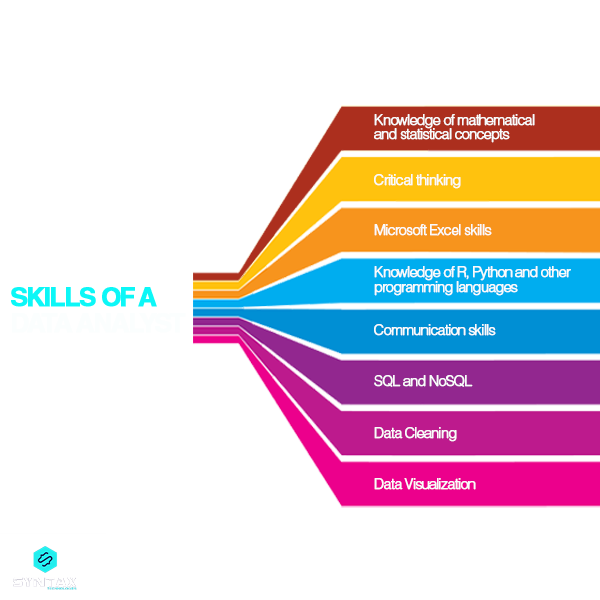
In order to become a Data Analyst, you need to cultivate certain specific skills. These include:
- Sound understanding of statistical and mathematical concepts
- Capability to work with data models and data packages
- Knowledge of different programming languages including Python and others
- Sound knowledge of SQL databases
- Comprehensive understanding of the fundamentals of Web Development
- Knowledge of Microsoft Excel
- Being able to understand processes such as data mapping, data management, data manipulation, data visualization, and so on
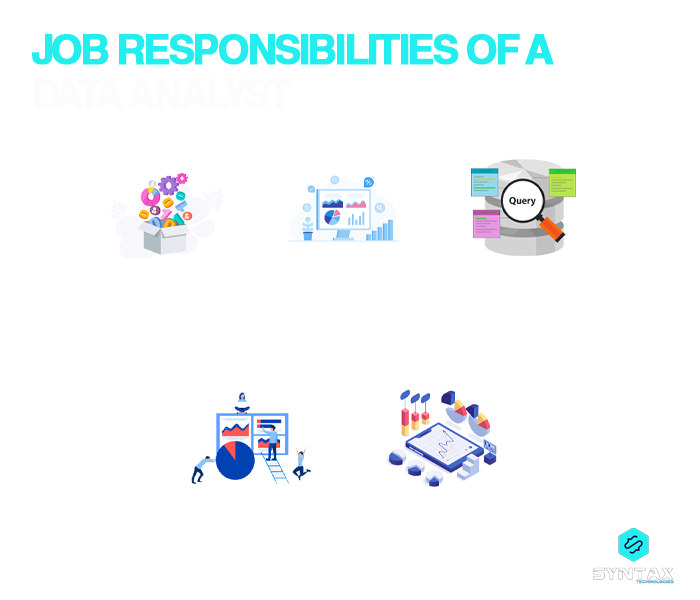
2. What are the prime responsibilities of a Data Analyst?
In general, the position of a Data Analyst would include the execution of the following responsibilities:
- They need to derive meaning from data with the aim of analyzing it, in line with the requirements of the business
- Data analysts have the responsibility to generate findings in the form of reports which help other individuals to decide upon the further course of action
- They need to perform an analysis of the market in order to make sense of the strengths and shortcomings of its competitors
- Data Analysts need to utilize data analysis for improving business performance in line with the requirements and needs of the customers
3. What is the difference between Data Mining and Data Analytics?
- Data Mining
Data Mining is the process of identifying patterns in stored data. It is performed on well-documented and clean data, and is generally used for Machine Learning wherein analysts simply identify patterns with the help of algorithms. The results obtained from the process are not easily comprehensible.
- Data Analytics
Data Analytics is the process of deriving insights from raw data by way of cleaning, organizing and ordering it in a meaningful manner. This raw data might not necessarily ne originally present in a well-documented form. The results obtained from the process are far easily comprehensible, than in the case of Data Mining.
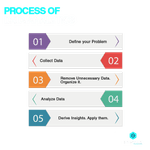
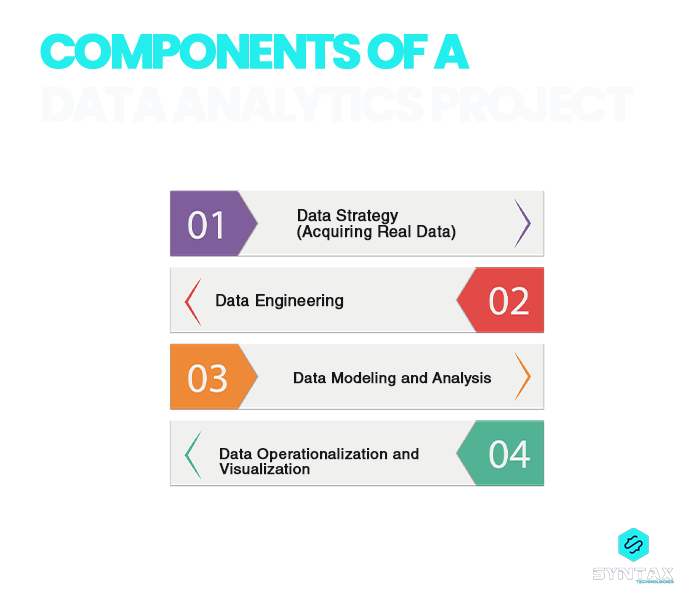
4. What is the process of Data Analytics?
The process of Data Analytics follows a certain path:
- Identification of the Problem: This step would encompass understanding a problem within a business enterprise, identifying the objectives and goals to be achieved and drafting a solution for solving the problem.
- Collection of Data: This step would involve collection of relevant data from all possible data points and sources in order to address the problem.
- Organizing and Data Cleaning: The data collected is most likely to be in an unrefined form. It would be required to organize it as well as clean it by removing all forms of irrelevant, redundant and unwanted bits, in order to make it suitable for analysis.
- Analysis of Data: This step is the final rung of the Data Analytics ladder wherein the professional applies the different Data Analytics tools, techniques and strategies in order to analyze data, derive insights from it and consequently, predict future outcomes as well as generate solutions to the problem concerned.

5. What is the difference between Data Mining and Data Profiling?
- Data Profiling
Data Profiling is the process of analyzing the individual particular attributes of data. Thus, it helps in providing information on specific attributes like length, data type, value range, frequency and so on. This process is usually undertaken in order to assess a dataset for its consistency, uniqueness and logic.
- Data Mining
Instead of focusing upon particular attributes, Data Mining lays emphasis upon the relation between different attributes. It seeks to identify data clusters, discover sequences, identify unusual records, dependencies and so on. The process is undertaken in order to find out relevant information which was not identified earlier.
6. What is Data Validation?
As the name suggests, the process of Data Validation involves determining the quality of the source and the accuracy of data. The process of Data Validation can take different forms:
- Form Level Validation: After the user completes the entire form and submits it, this process of validation begins. It scrutinizes the entire data entry form, validates all fields and highlights errors
- Search Criteria Validation: This technique is used to provide the user with the most accurate and relevant matches and results for their searched phrases and keywords
- Field Level Validation: Data Validation is done at the level of each field as the user enters data for each of them
- Data Saving Validation: When a database record or an actual file is being saved, this technique is used
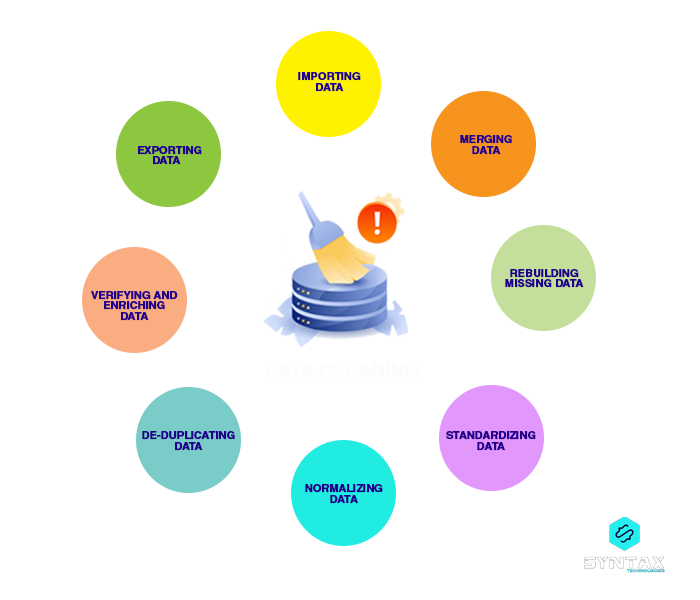
7. What is Data Cleaning? How to practice it?
Data Cleansing is also referred to as Data Wrangling. It is the process of cleaning, enriching and structuring raw data into a usable desired format which could be used for decision making. It involves the process of identifying and removing inconsistencies, bugs and errors from the data in order to improve its quality.
The best practices for Data Cleaning include:
- Segregating and classifying data on the basis of their attributes
- In case of large datasets, it would be wise to dissociate them into smaller chunks which increases the iteration speed
- Moreover, in case of large datasets, it is important to perform data cleaning step wise, until one is convinced of the quality of the data at hand
- Analyze the statistics for each column
- Developing a set of scripts or utility functions for performing common cleaning activities
- It is important to keep a track of every cleaning activity and operation so that operations can be removed and changes can be introduced, if required
8. What are some of the Common Problems faced by a Data Analyst?
Some of these problems are:
- Spelling mistakes and duplicate entries which adversely affects the quality of data
- The usage of multiple sources of data might result in varying value representations
- Dependency on unreliable and unverified sources for data extraction results in acquisition of poor quality data. This will in turn increase the time spent on Data Cleaning
- Overlapping and Incomplete data also pose significant challenge to a Data Analyst
- Illegal and Missing Values
9. Define Outlier and Collaborative Filtering?
This is one of the typical Data Analyst Interview Questions.
- Outliers
An outlier refers to a value which appears to be divergent or far removed from a set pattern in a sample. In other words, in a dataset, it is a value which is away from the mean of the characteristic feature of the dataset. There are two kinds of outliers: Univariate and Multivariate.
- Collaborative Filtering
It is an algorithm which creates a recommendation system on the basis of the behavioral data of the user. The components of Collaborative Filtering are: users, items and interest.
For instance, you might come across a recommended section as you browse through your Netflix account. The particular shows or movies or series which form a part of the recommended section, are carefully curated on the basis of your past searches and watch history.
The way in which Collaborative Filtering works through Matrix Factorization for business giants, is quite an interesting aspect of Data Analytics. If you wish to know more about the process, you can refer to the video here:?
10. What is the KNN Imputation method?
KNN or K-Nearest Neighbor is a method of imputing the values of the missing attributes with the values of those attributes which are most similar to the attributes whose values are missing. The similarity between the two attributes is determined using the distance function.
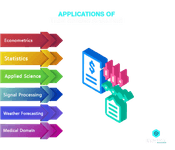
11. What are the common statistical methods used by Data Analysts?
Some of the common statistical methods are:
- Bayesian Methodologies
- Cluster Analysis
- Markov Process
- Imputation Techniques
- Rank Statistics, Outliers Detection, Percentiles
- Simple Algorithm
- Mathematical Optimization?
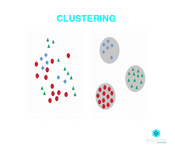
12. What is Clustering?
Another common Data Analyst Job Interview Question pertains to the different methods which can be used for improved management of data. Clustering is one of those classification methods. It helps in sorting the data into groups or clusters. The properties of a clustering algorithm are:
- Flat or Hierarchical
- Soft or Hard
- Disjunctive
- Iterative

?
Intermediate Level Interview Questions for Data Analyst
13. How to handle missing or suspicious data?
There are a number of ways that a Data Analyst can adopt while dealing with suspicious or missing data.
- They shall try to detect the missing data through various techniques like single imputation methods, model-based methods, deletion methods and so on
- They can prepare a validation report which contains all possible detail of the data under question
- The question of acceptability of suspicious data can be relegated to an experience Data Analyst personnel
- Invalid data should be replaced with up-to-date and valid data
14. What is Time Series Analysis? When is it used?
Time Series Analysis is essentially a statistical technique which is widely used while working with time series data or trend analysis. Time series data refers to the presence of data at set periods or particular intervals of time. It refers to an ordered sequence of values of a variable at equally spaced time intervals.
15. What is a hash table and hash table collision?
This is another classic Data Analyst Interview Questions. A hash table is a data structure which stores data in an associative manner. It refers to a map of keys to values, which is used to compute an index into an array of slots, from which desired values can be derived.
A hash table collision takes place when two separate keys hash to the same value. Hash table collision can be prevented through:
- Separate Chaining
- Open Addressing
16. What are the characteristics of a good data model?
- A good data model is one which has predictable performance. This helps in estimating the outcomes accurately
- A good model is one which is able to scale according to any change in the data
- A good data model is one which is responsive and adaptive which means that it should be able to incorporate the changing business needs with time
- A data model is said to be good when it can be easily consumed by consumers and clients for profitable and actionable results
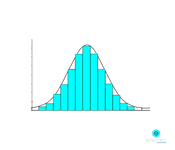
17. What is n-gram and normal distribution?
N-gram refers to a continuous sequence of n-items in a given speech or text. It is a type of probabilistic language model which helps in predicting the next item in such a sequence in the form of n-1.
As far as Interview Questions for Data Analyst is concerned, one of the popular queries has been on the idea of normal distribution. It happens to be one of the most widely used and important distributions in statistics, which is also known as the Gaussian or the Bell curve. It is a probability function which describes and measures the way in which the values of a variable are distributed.
This indicates the way in which they differ in their mean and their standard deviation. In this case, the random variables are distributed in the form of a symmetrical bell shaped curve. Data is distributed around a central value without any bias to the left or the right side.
18. Explain univariate, bivariate and multivariate analysis.
- Univariate analysis
It is one of the simplest statistical techniques and easiest form of data analysis wherein the data being analyzed contains only one variable. It can be described using Dispersion, Central Tendency, Bar Charts, Frequency Distribution Tables, Histograms, Quartiles and Pie Charts. Example: Studying the salary of workers in an industry.
- Bivariate Analysis
This kind of analysis seeks to analyze the relationship between two variables. It seeks to answer such questions as if there is any association between the two variables and what is the intensity of that association. If the answer is negative, then it seeks to see if there are any differences between the two and what is the importance of these differences. Example: Studying the relation between alcohol consumption and cholesterol levels.
- Multivariate Analysis
This technique can be considered to be an extension of the bivariate analysis as it seeks to analyze the relationship between three or more variables. It observes and analyzes the independent variables in order to predict the value of a dependent variable. This kind of analysis can be undertaken using Factor Analysis, Cluster Analysis, Multiple Regression, Dual-Axis Charts and so on. Example: A Company which has collected data pertaining to its customer?s age, gender, their purchase history and so on and seeks to study the relation between these different independent and dependent variables.
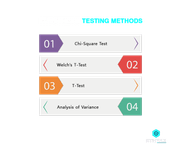
19. What are the different types of Hypothesis Testing methods?
The different methods of hypothesis testing are:
- Chi-Square Test
This test is used in order to find the association between the categorical variables in the population sample
- Welch?s T-Test
This test is used to find out the test for equality of means between two population samples
- T-Test
This test is used when the size of the population sample is relatively small and when the standard deviation is unknown
- Analysis of Variance (ANOVA)
This test is used to analyze the difference between the means of in various groups. It is kind of similar to the T-Test but is used for more than two groups
20. What is the difference between variance and covariance?
Within the statistical domain, variance and covariance are two of the most commonly used mathematical terms.
Variance highlights how distant two quantities or numbers are in relation to the mean value. This helps in knowing the magnitude of relation between the two numbers (how much of the data is spread around the mean).
Covariance highlights the way in which two random numbers will change together. Thus, it depicts the magnitude as well as direction of change as well as the correlation between the variables.
21. How do you highlight cells with negative values in Excel?
This happens to be one classic Data Analyst Technical Interview Questions. A Data Analyst can highlight cells with negative values in an Excel sheet, using conditional formatting. The steps for conditional formatting are:
- Select the cells which have negative values
- Go to the Home tab and choose the Conditional Formatting option
- Then, Go to the Highlight Cell Rules and select the Less Than option
- Navigate to the dialogue box of Less Than option and Enter the value as ?0?

22. What is a Pivot Table? What are its different sections?
Pivot Table happens to be a common feature of Microsoft Excel. They allow users to view and summarize large datasets in the simplest way possible. It provides simple drag/drop functions which help in easy generation of reports.
A pivot table is made up of different sections:
- Rows Area: It includes the headings which are present on the left of the values
- Filter Area: This is an optional filter which helps in zooming into a data set
- Values Area: This area includes the values
- Column Area: This includes headings at the top of the values area
Advanced Level Data Analyst Interview Questions
In this section, we will look at some of the Data Analyst Interview Questions which may not be directly technical, but can be more analytical in nature in terms of assessing the perception of the prospective candidate.
23. What are the advantages of Version Control?
Advantages:
- It facilitates the comparison of files, identification of differences as well as the consolidation of changes
- It provides for the easy maintenance of a complete history of project files which becomes useful in case of a central server breakdown
- It provides for the security and maintenance of multiple variants and versions of code
- It facilitates easy tracking of the lifecycle of a built application
- It offers the possibility to visualize changes made in the content of different files
24. What is imputation? What are the different techniques of the same?
Imputation is the process of replacing missing data with substituted values.
The different techniques of imputation are:
- Single Imputation
- Cold deck Imputation
- Regression Imputation
- Hot-deck Imputation
- Stochastic Imputation
- Mean Imputation
- Multiple Imputation
25. What is the future of Data Analytics?
In case of these types of Interview Questions for Data Analyst, it will be important for you as an aspiring Data Analyst to showcase your knowledge of the domain in performing data analysis. It is not simply enough to state existing facts, but it would be worthwhile to refer to credible research which can demonstrate the growing relevance of the field of Data Analytics. Moreover, you can also make references to the way in which Artificial Intelligence is gradually having a significant impact on the field of Data Analytics.?
26. What past Data Analytics projects have you been involved in?
This is one such Data Analyst Job Interview Question which serves multiple purposes. The interviewer does not simply want to know the topic of the project that you may have been involved in the past. On the contrary, he is most likely to be interested in your insights from your involvement in the project, the clarity with which you are able to communicate about your own work as well as evaluating your debating skills if you happened to be questioned on a particular aspect of your project.
27. Which step of the Data Analytics project do you like the most?
These Data Analyst Interview Questions can be tricky. Humans have an inclination to develop a liking towards certain tasks and tools. However, Data Analytics is not a single activity, but a collection of several tasks undertaken with the help of different tools. Hence, even if you feel tempted in terms of speaking negatively about a certain tool or activity, it is in the best of your interest to maintain a balanced approach.
28. What steps have you taken to improve your analytical skills and knowledge?
These kinds of Data Analyst Interview Questions provide you with an opportunity to establish your position as someone who is adaptive, responsive and is an enthusiastic and avid learner. The field of Data Analytics is a rapidly evolving one. As someone seeking to establish his foothold in the same, you have to demonstrate your keenness towards keeping yourself updated in terms of the latest developments and changes within the tech field.?
29. Will you be able to communicate the technical aspect of your work to a non-technical audience?
This is yet another common Interview Questions for Data Analysts wherein you are expected to demonstrate your communication skills. Given the fact that the analytical lifecycle is in itself a collaborative outcome of several individuals, it is extremely important for you as a candidate to convince the interviewer that you are capable of working with people from different backgrounds (technical as well as non-technical). This means that you should be able to explain things convincingly, have the ability to break complex issues into understandable portions as well as have patience.
30. Why do you think that you will be the right fit for this position?
This question is best answered by highlighting your knowledge and understanding of the job description, of the Company as a whole as well as of the field of Data Analytics. You have to make connections between the three and accordingly place yourself within the loop by way of emphasizing upon your skills which would be useful in terms of accomplishing the goals and objectives of the firm.
Conclusion
By the end of this blog, you must have developed a fair understanding of some of the classic, common and yet important Data Analyst Interview Questions. This list of Data Analyst Interview Questions and Answers is definitely by no means exhaustive.
There can be several other Data Analyst Interview Questions for Freshers, for Experienced, technical ones, and so on. However, this article can serve as an important point of reference by giving you an idea of the important topics and issues to focus upon as you prepare to face the Interview Questions for Data Analyst.
Certifications in the field of Data Analytics, along with rigorous training in developing Data Analyst skills and hands-on experience in Data Analytics projects, can be valuable additions to your resume. Online Bootcamps can serve as wise choices if you wish to prepare yourself as a Data Analytics expert.
With end to end assistance, we, at Syntax Technologies, provide you with an exciting opportunity to achieve your goals with our Data Analytics and Business Intelligence course. Read more: